Broom Research
A proposal for a research project that studies the act of sweeping. This project is an experiment in taking industrial design research methodologies into everyday life. An apparatus is devised from a broom with measuring and testing abilities to conduct data-generating experiments to investigate the best possible conditions required for cleaning.
Completion: 19 September 2022
Duration: 2 Weeks
Duration: 2 Weeks
PHASE 1: APPARATUS
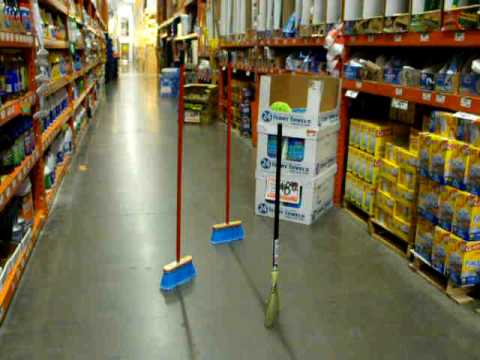
Broom Hunting at Home Depot
The creation of this tool began with a modest acquisition—a $15 broom procured from Home Depot. Finding the perfect broom meant that it could be altered and tampered with without losing the essence of “broomness.”
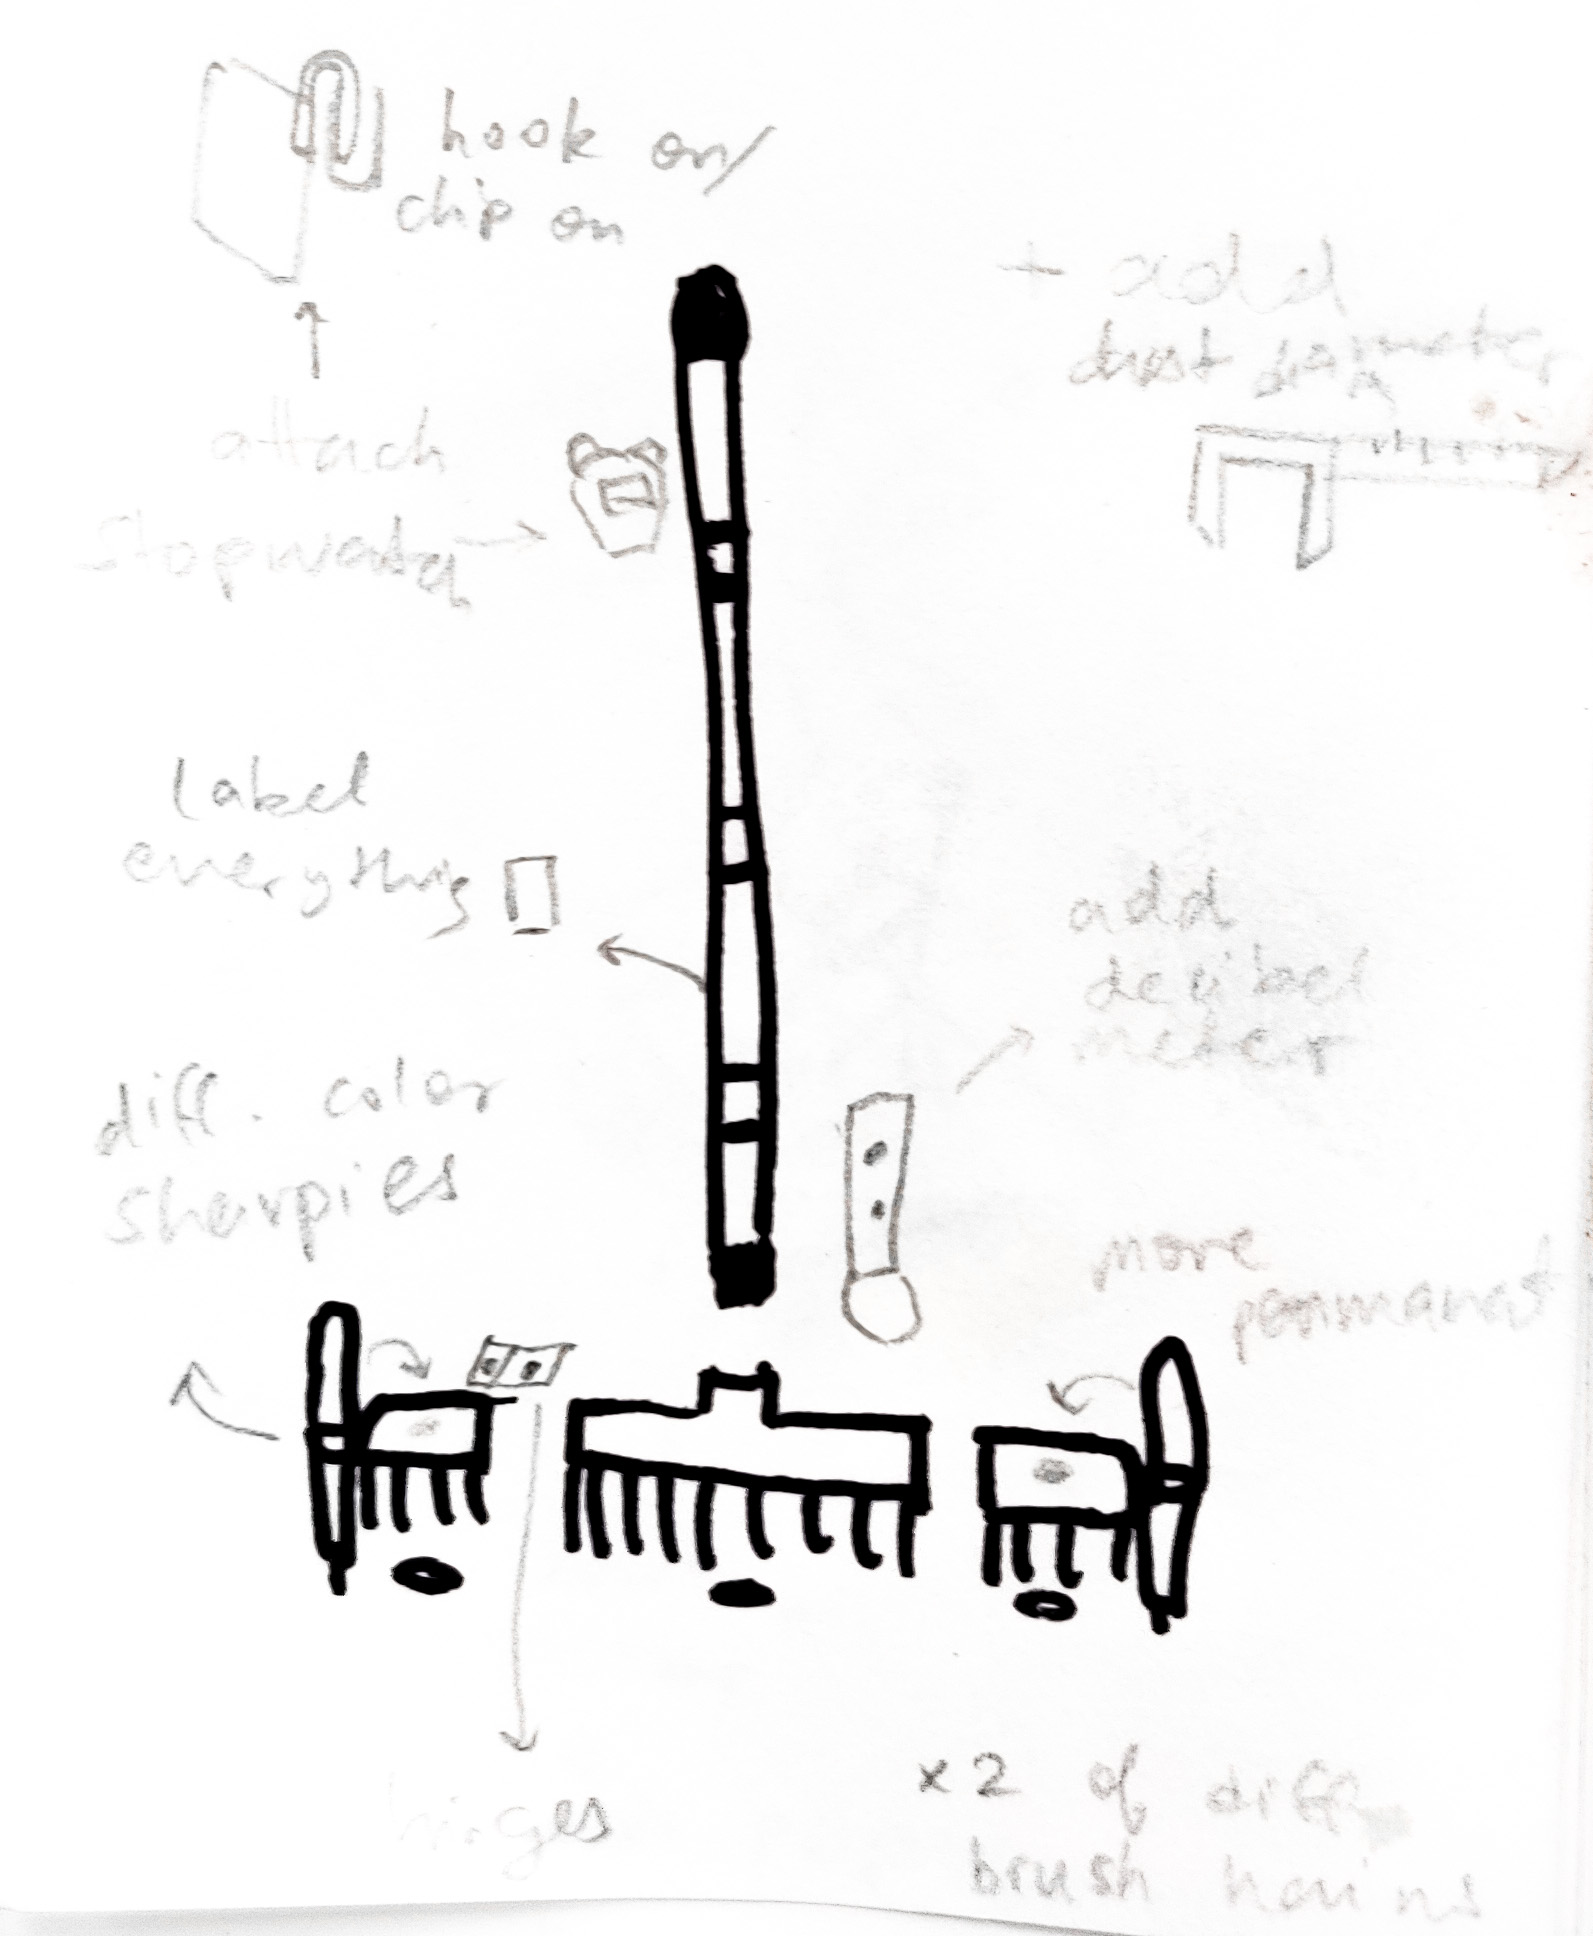
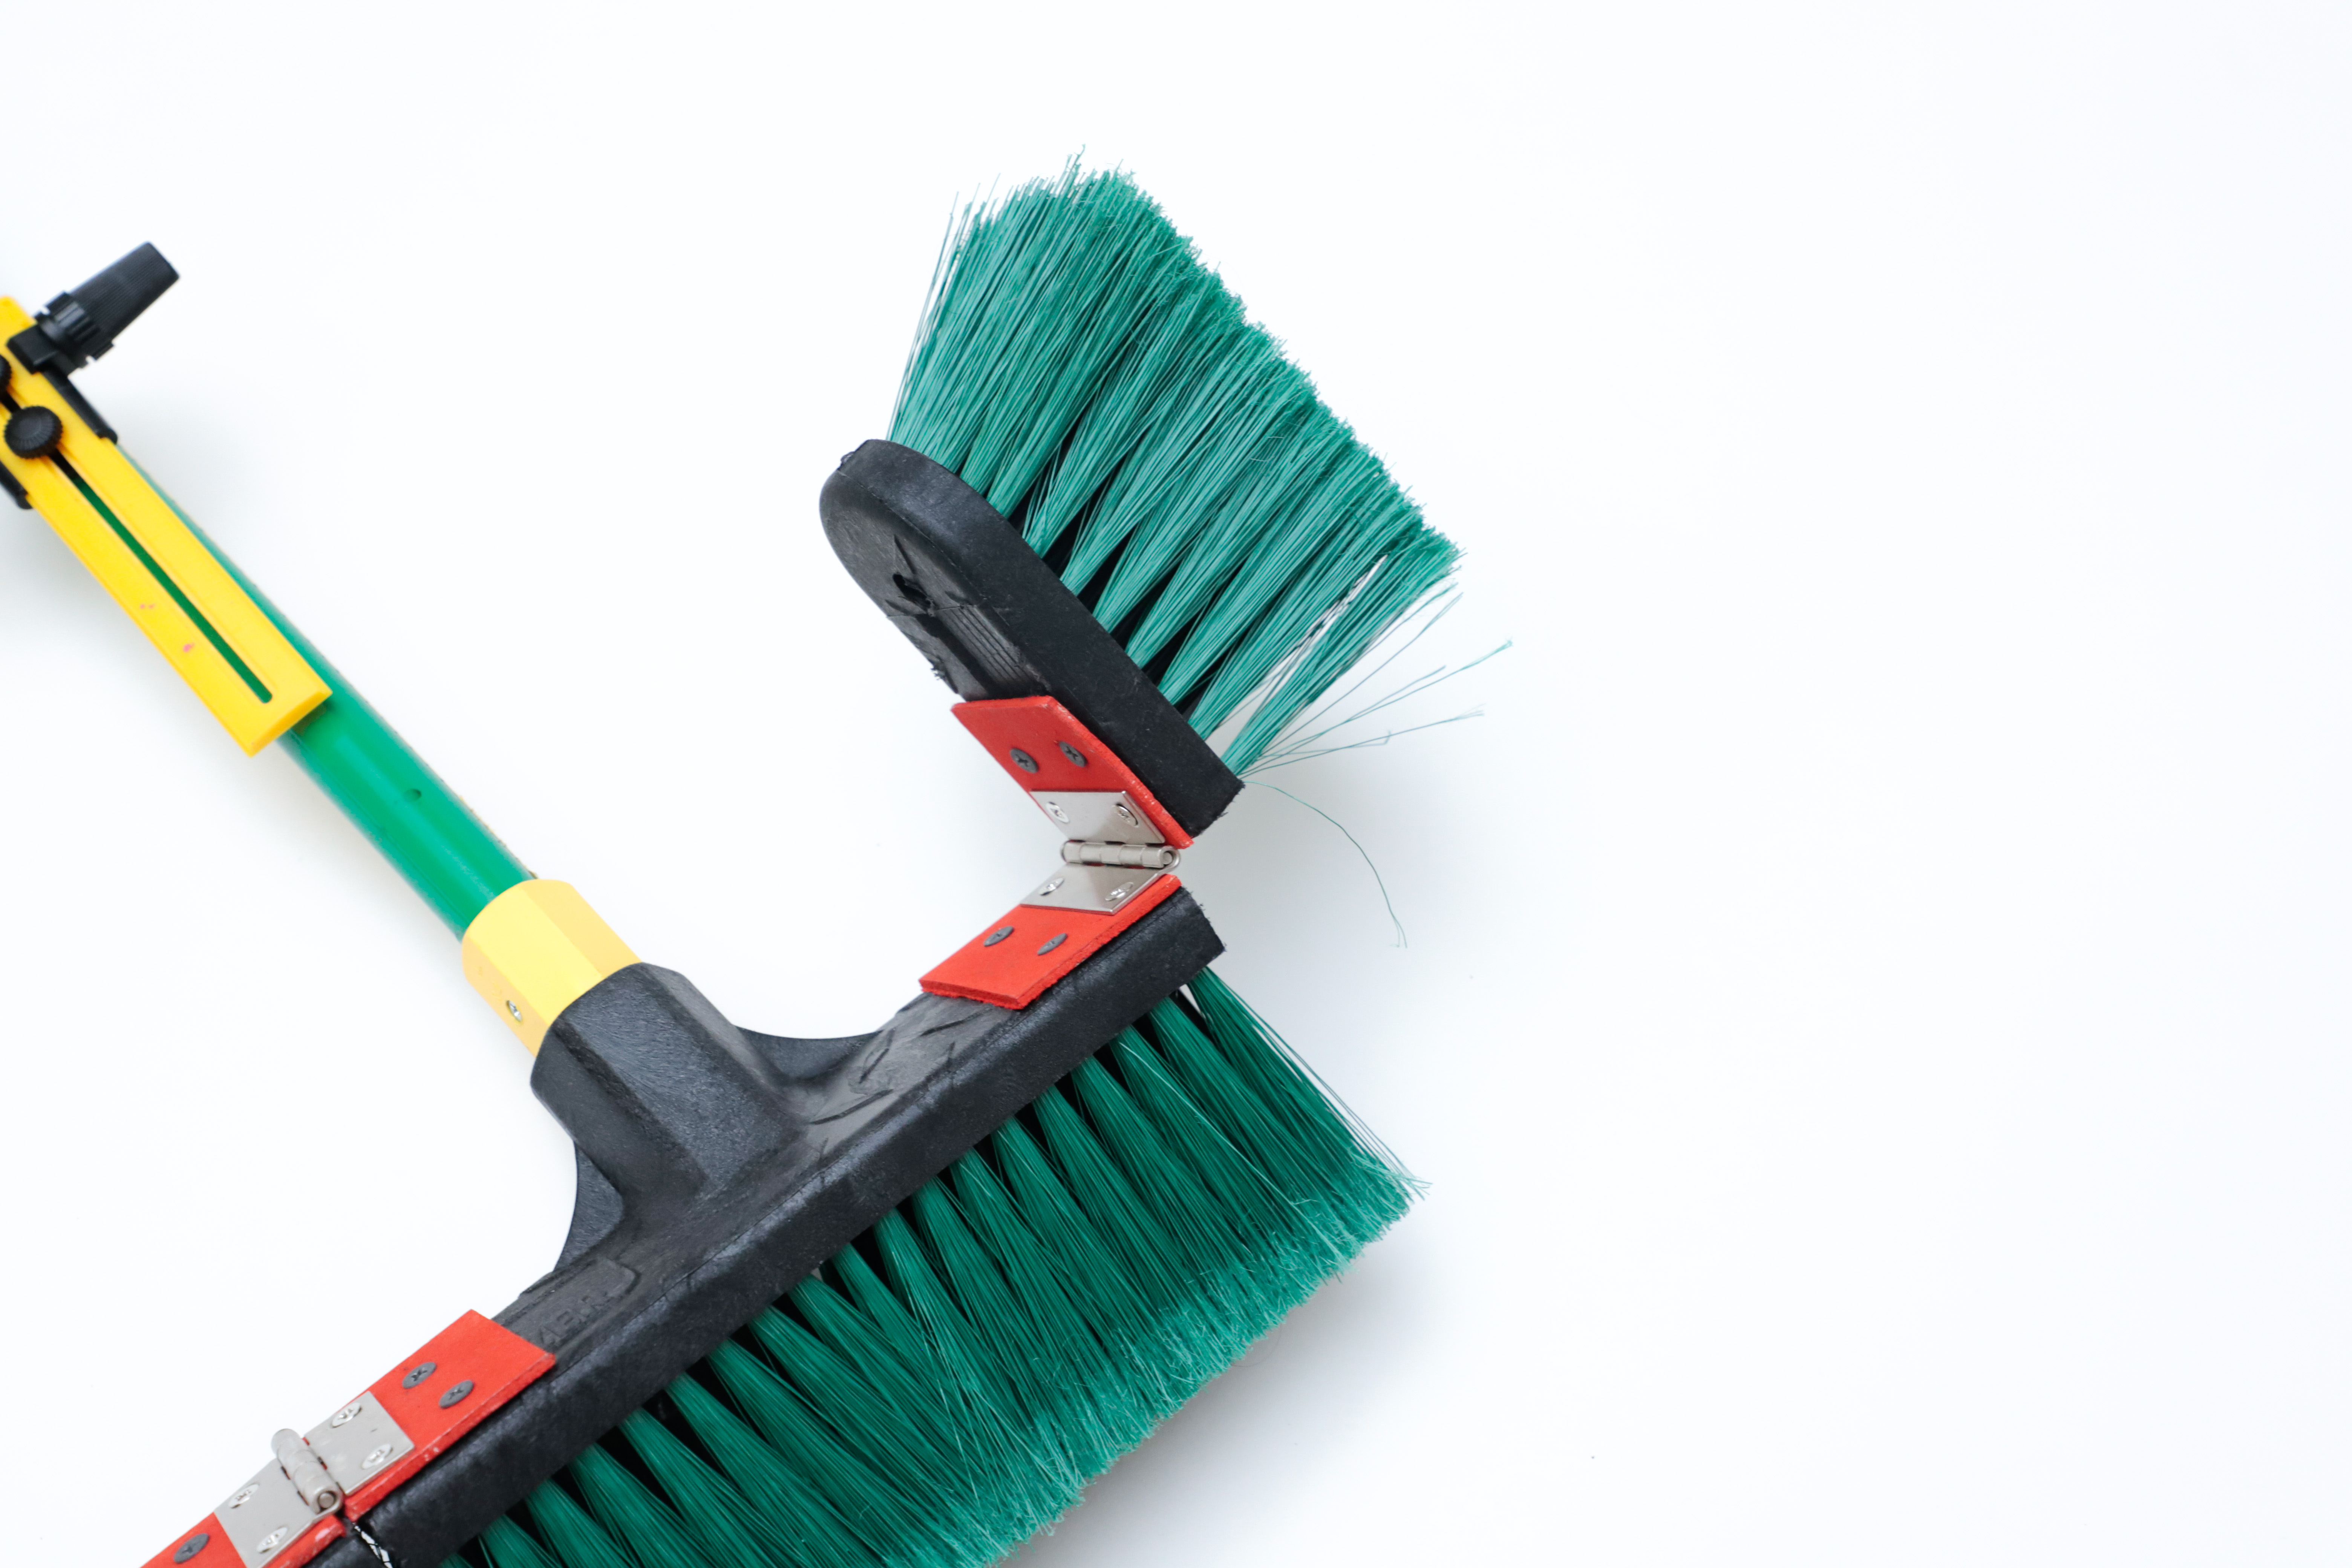
Retrofitting Measuring Devices
The broom is transfigured into the apparatus by making the broom itself modular and by the addition of other tools becoming a part of this new device. It is only at this stage of the process that the experiment can be devised.
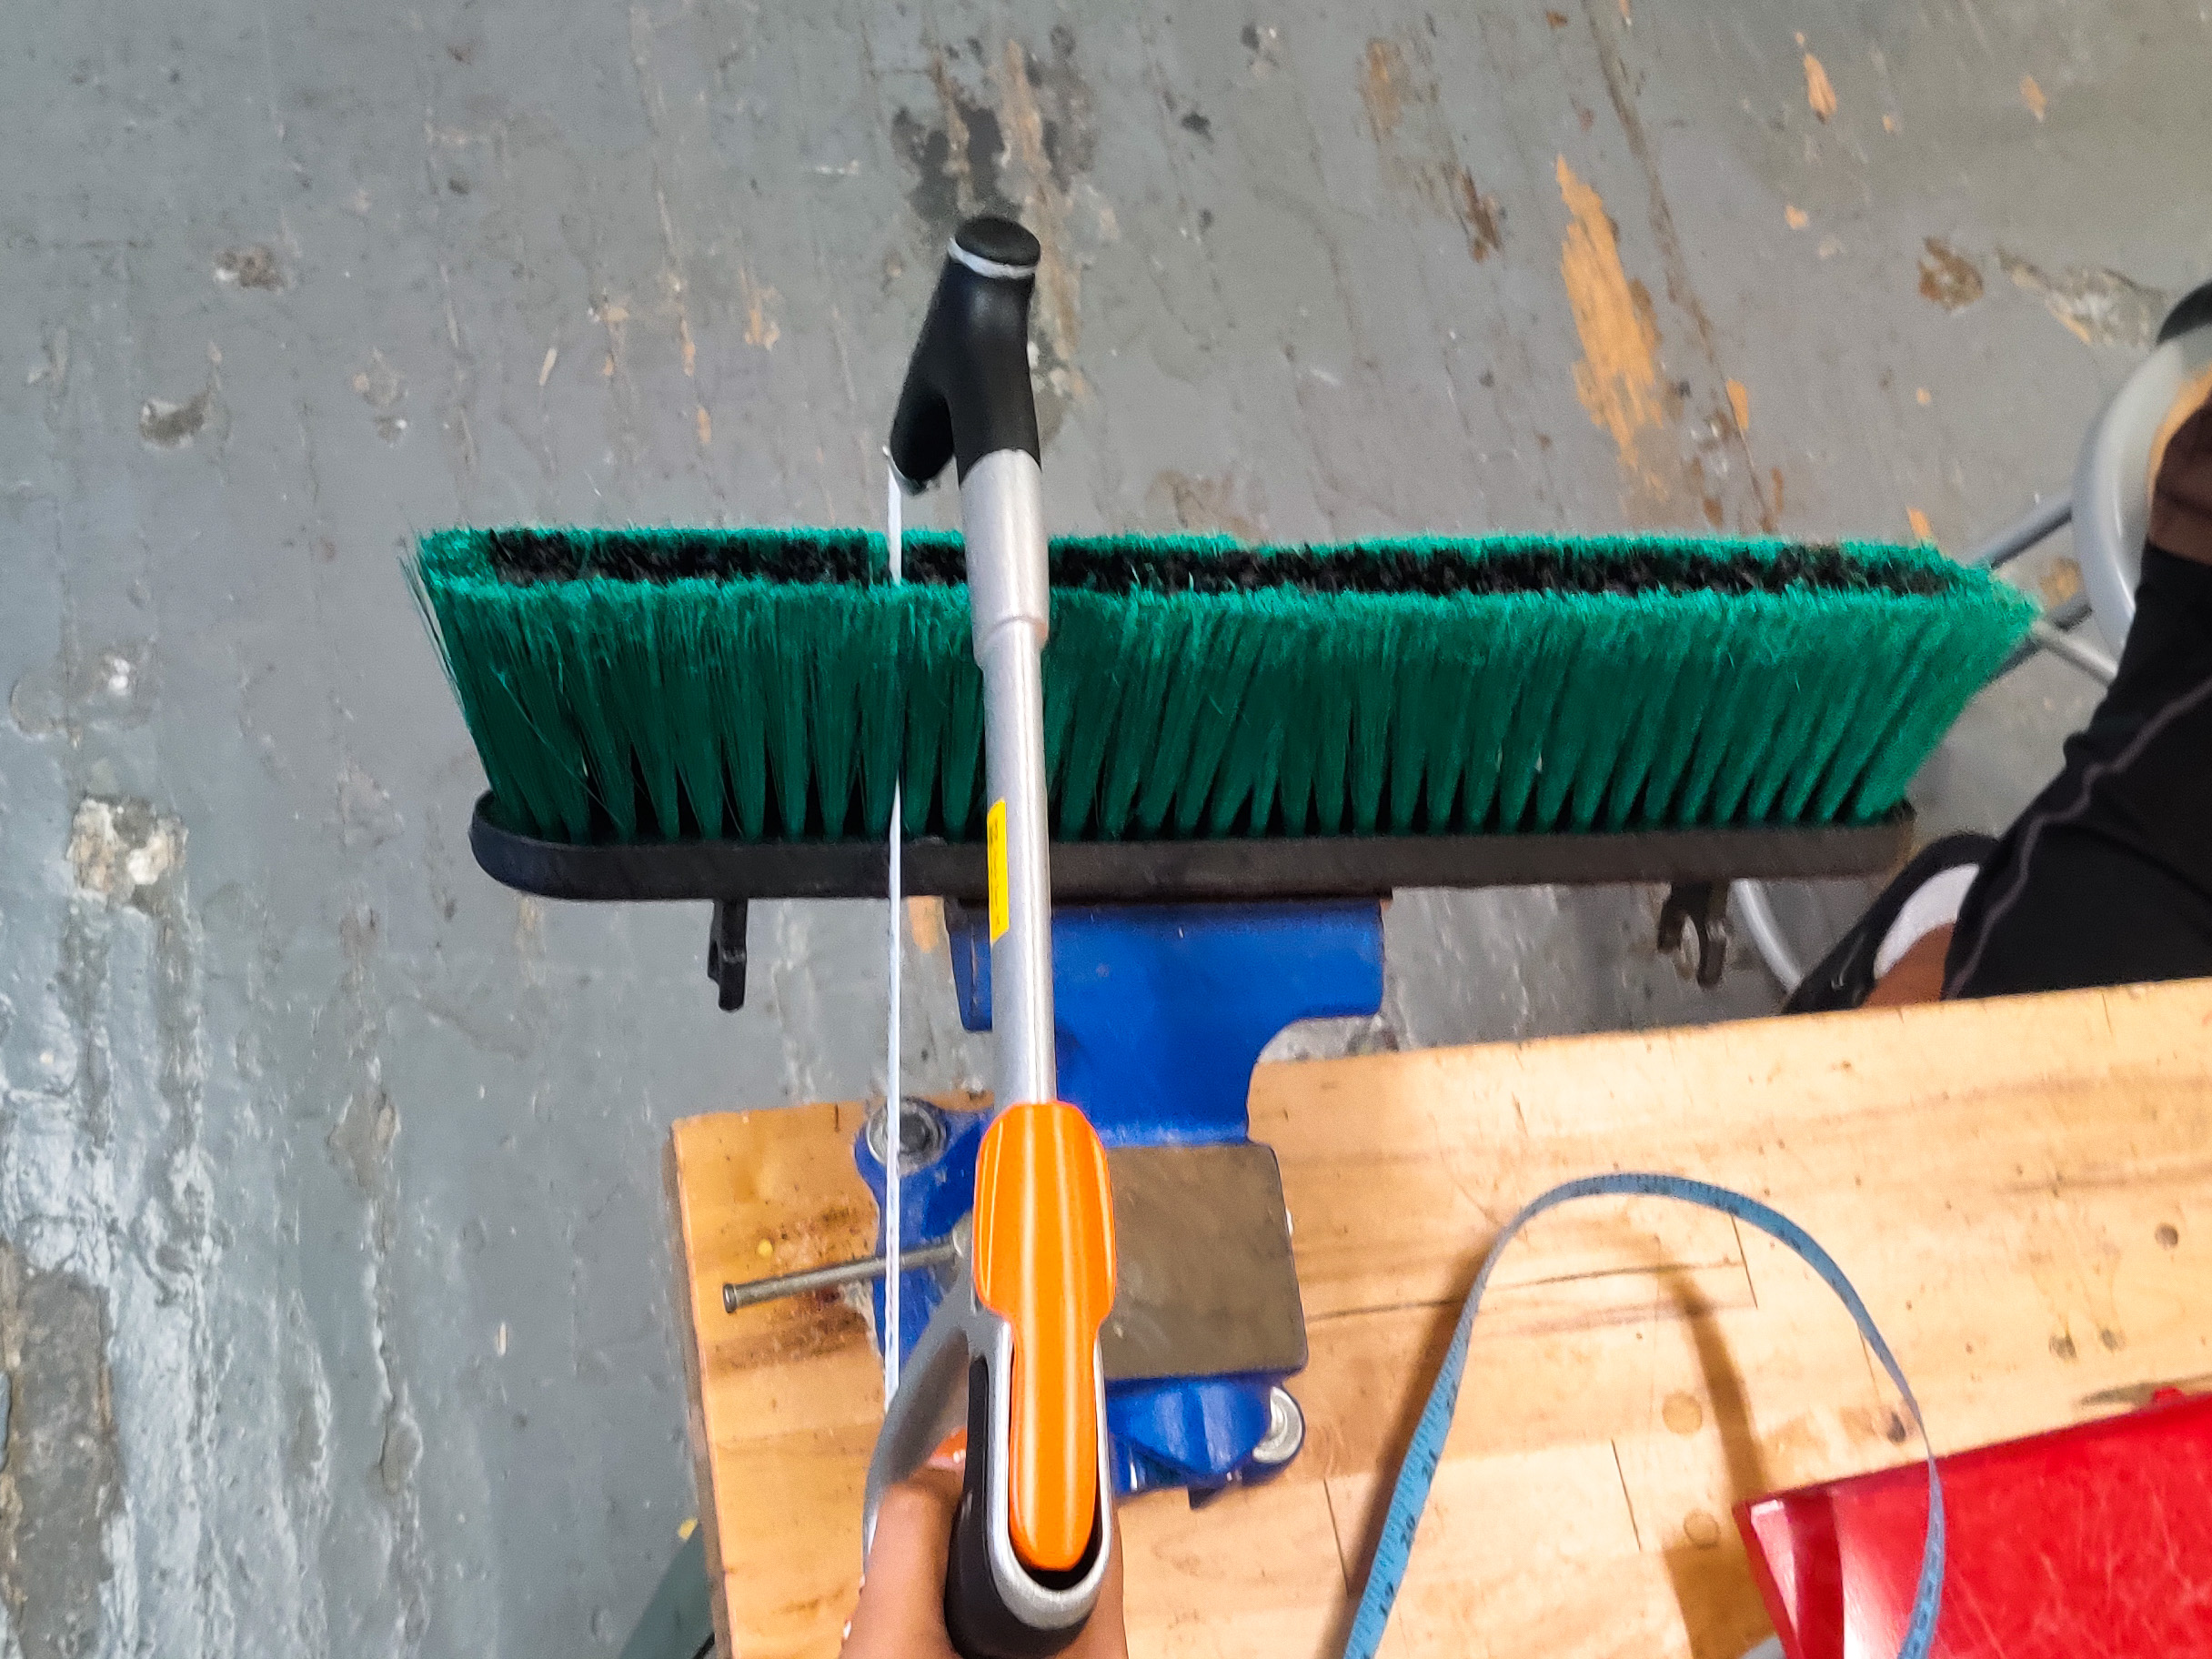 Cutting broom head with coping saw
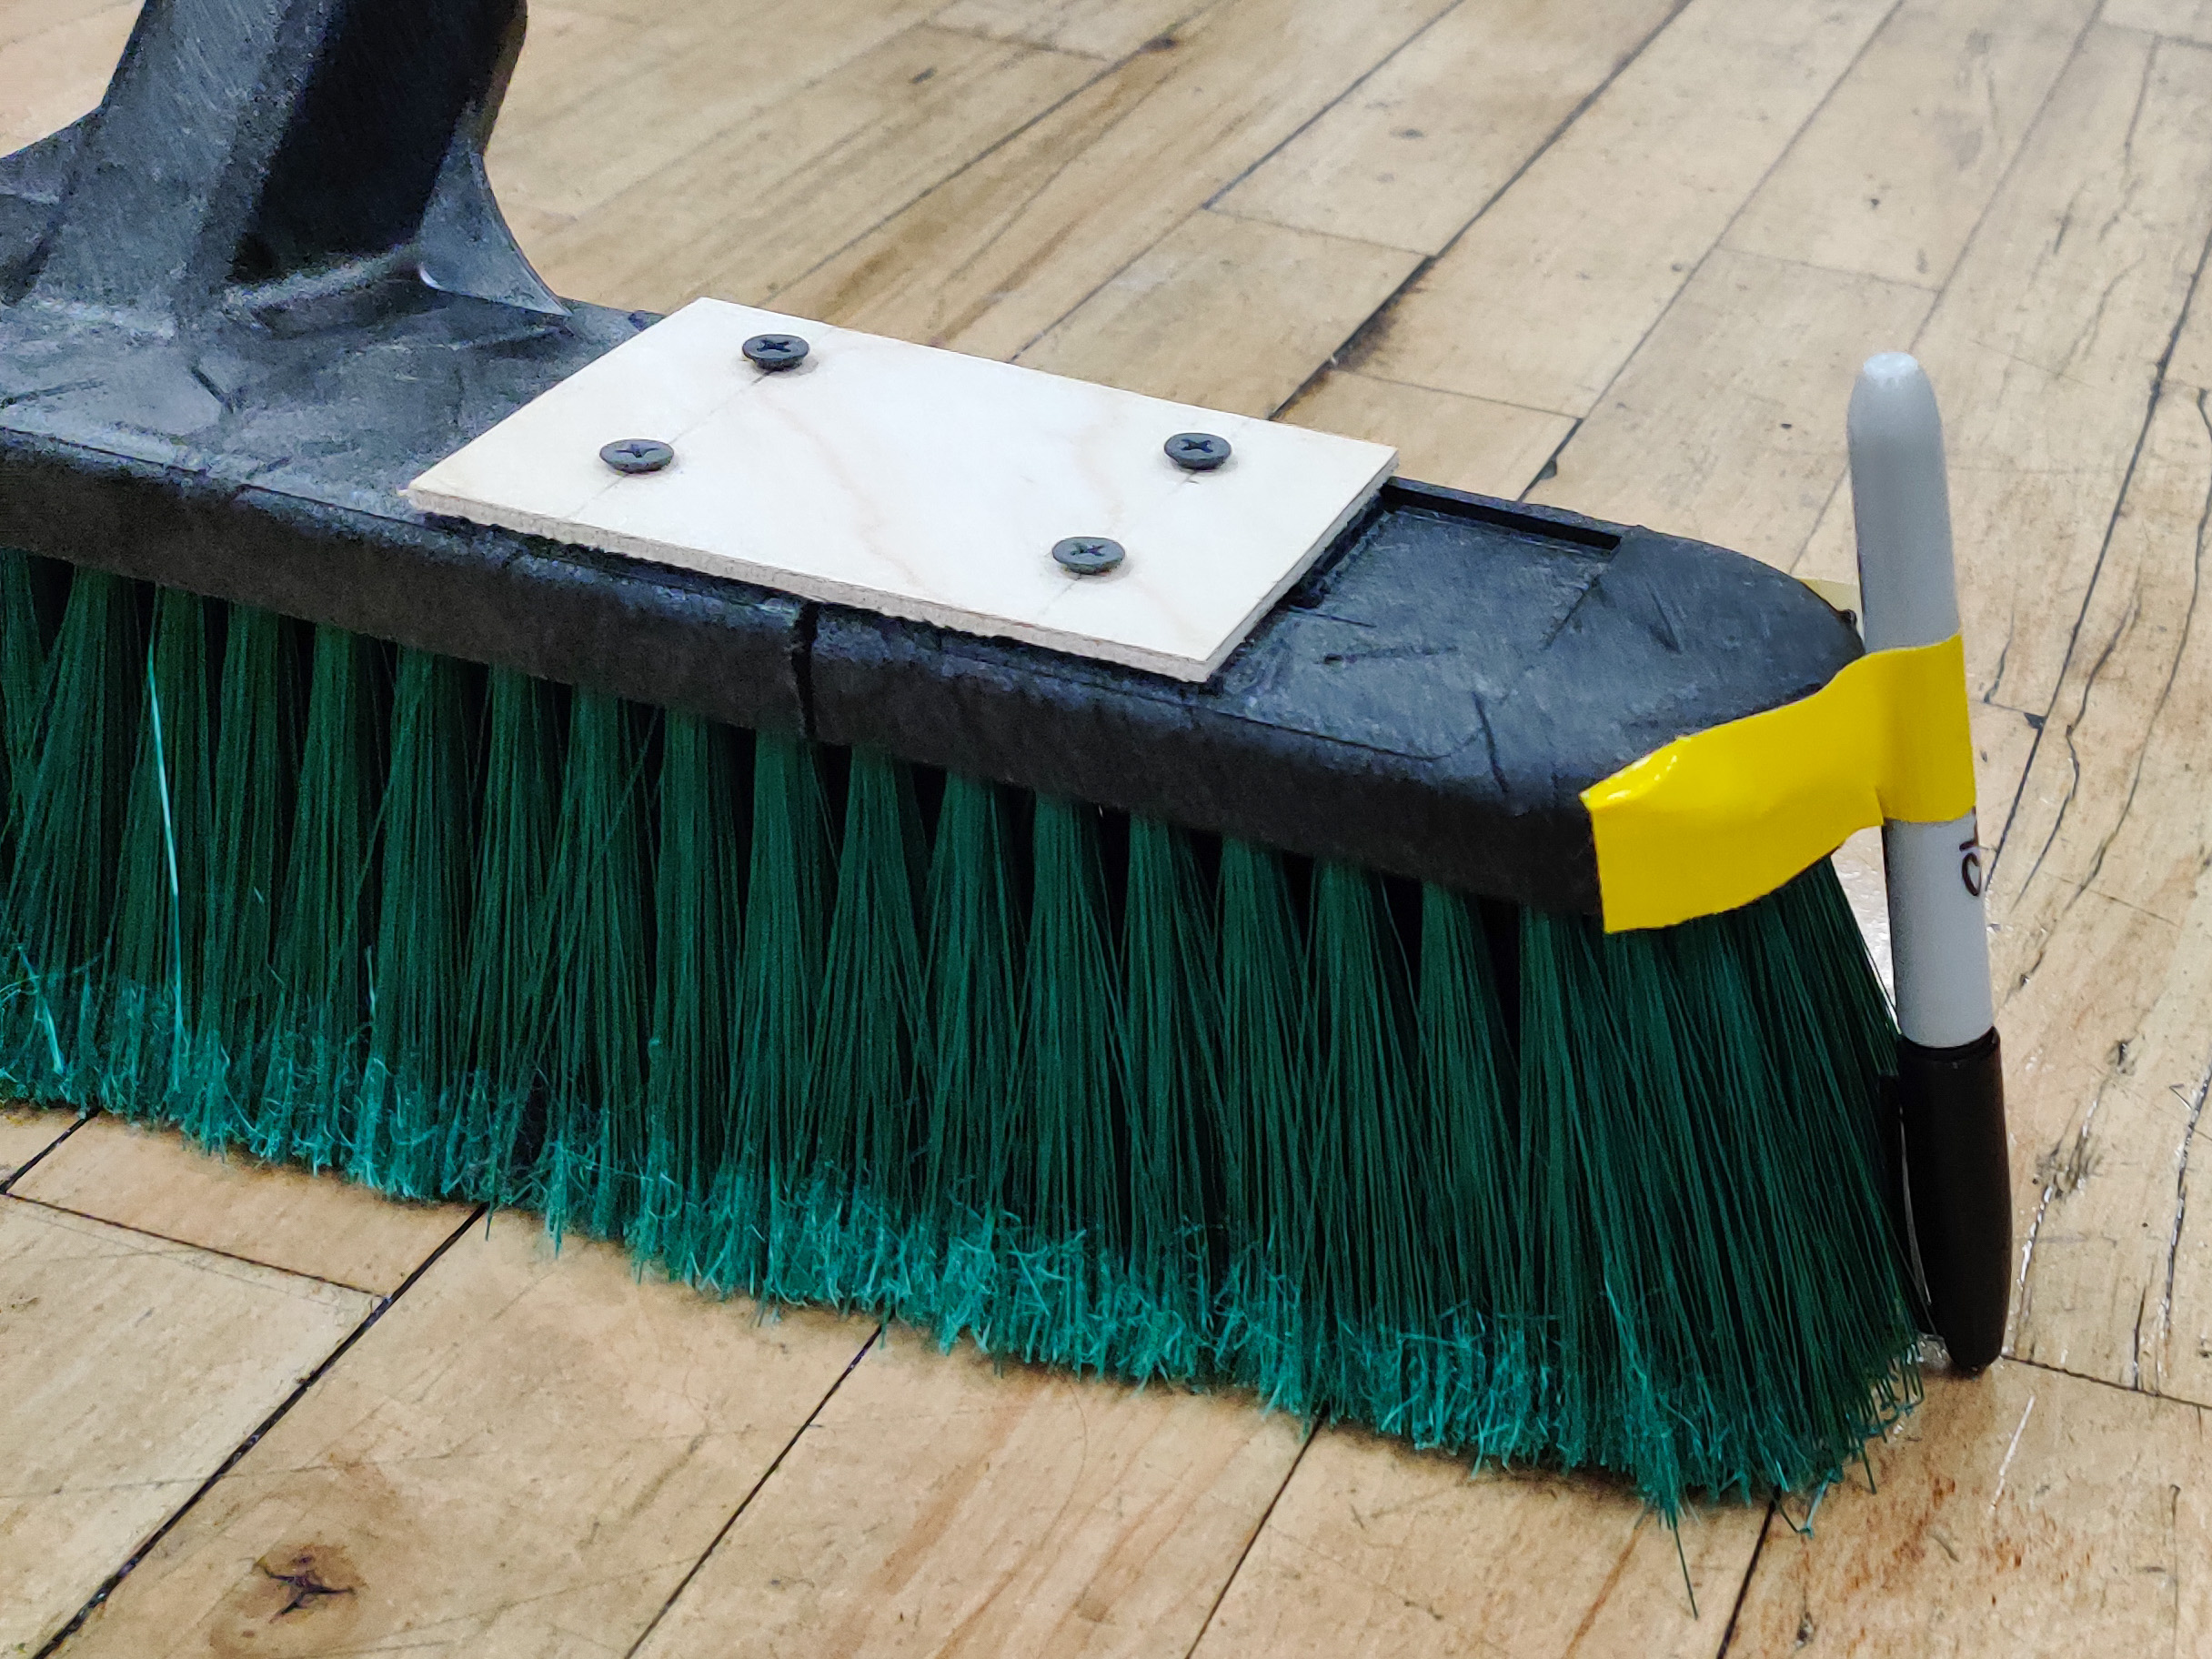
Testing height of sharpie vs. broom hair
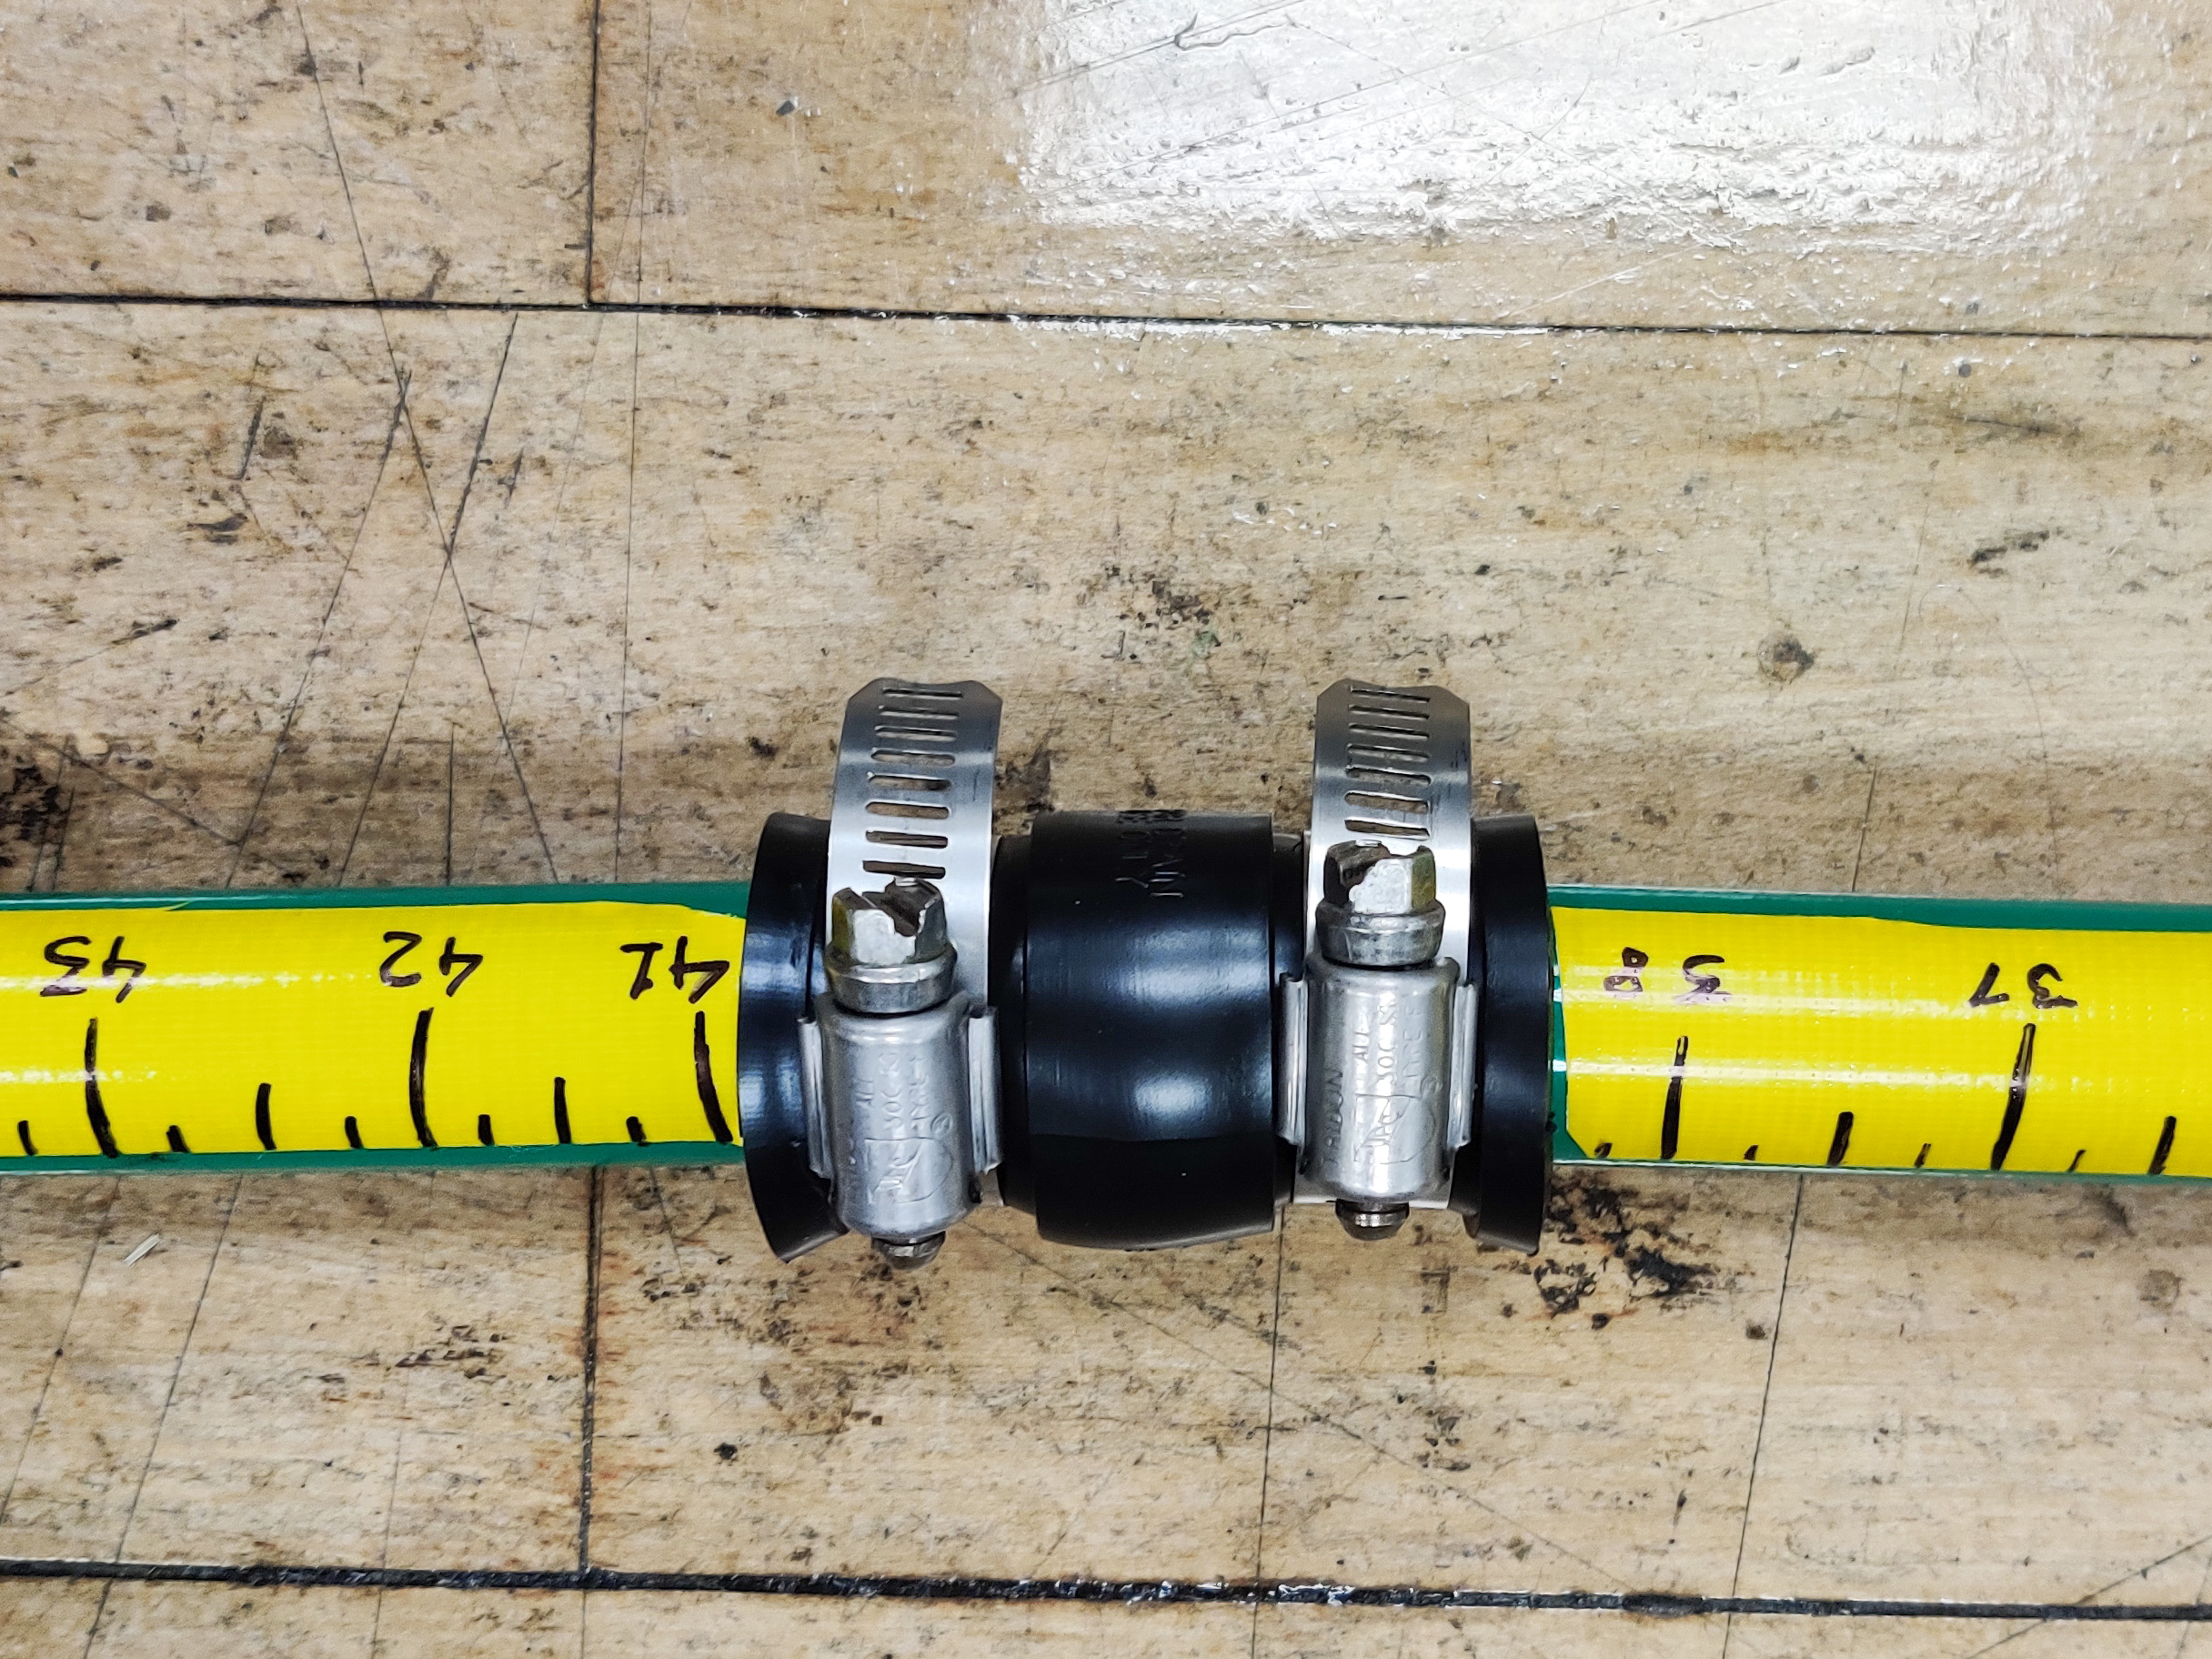
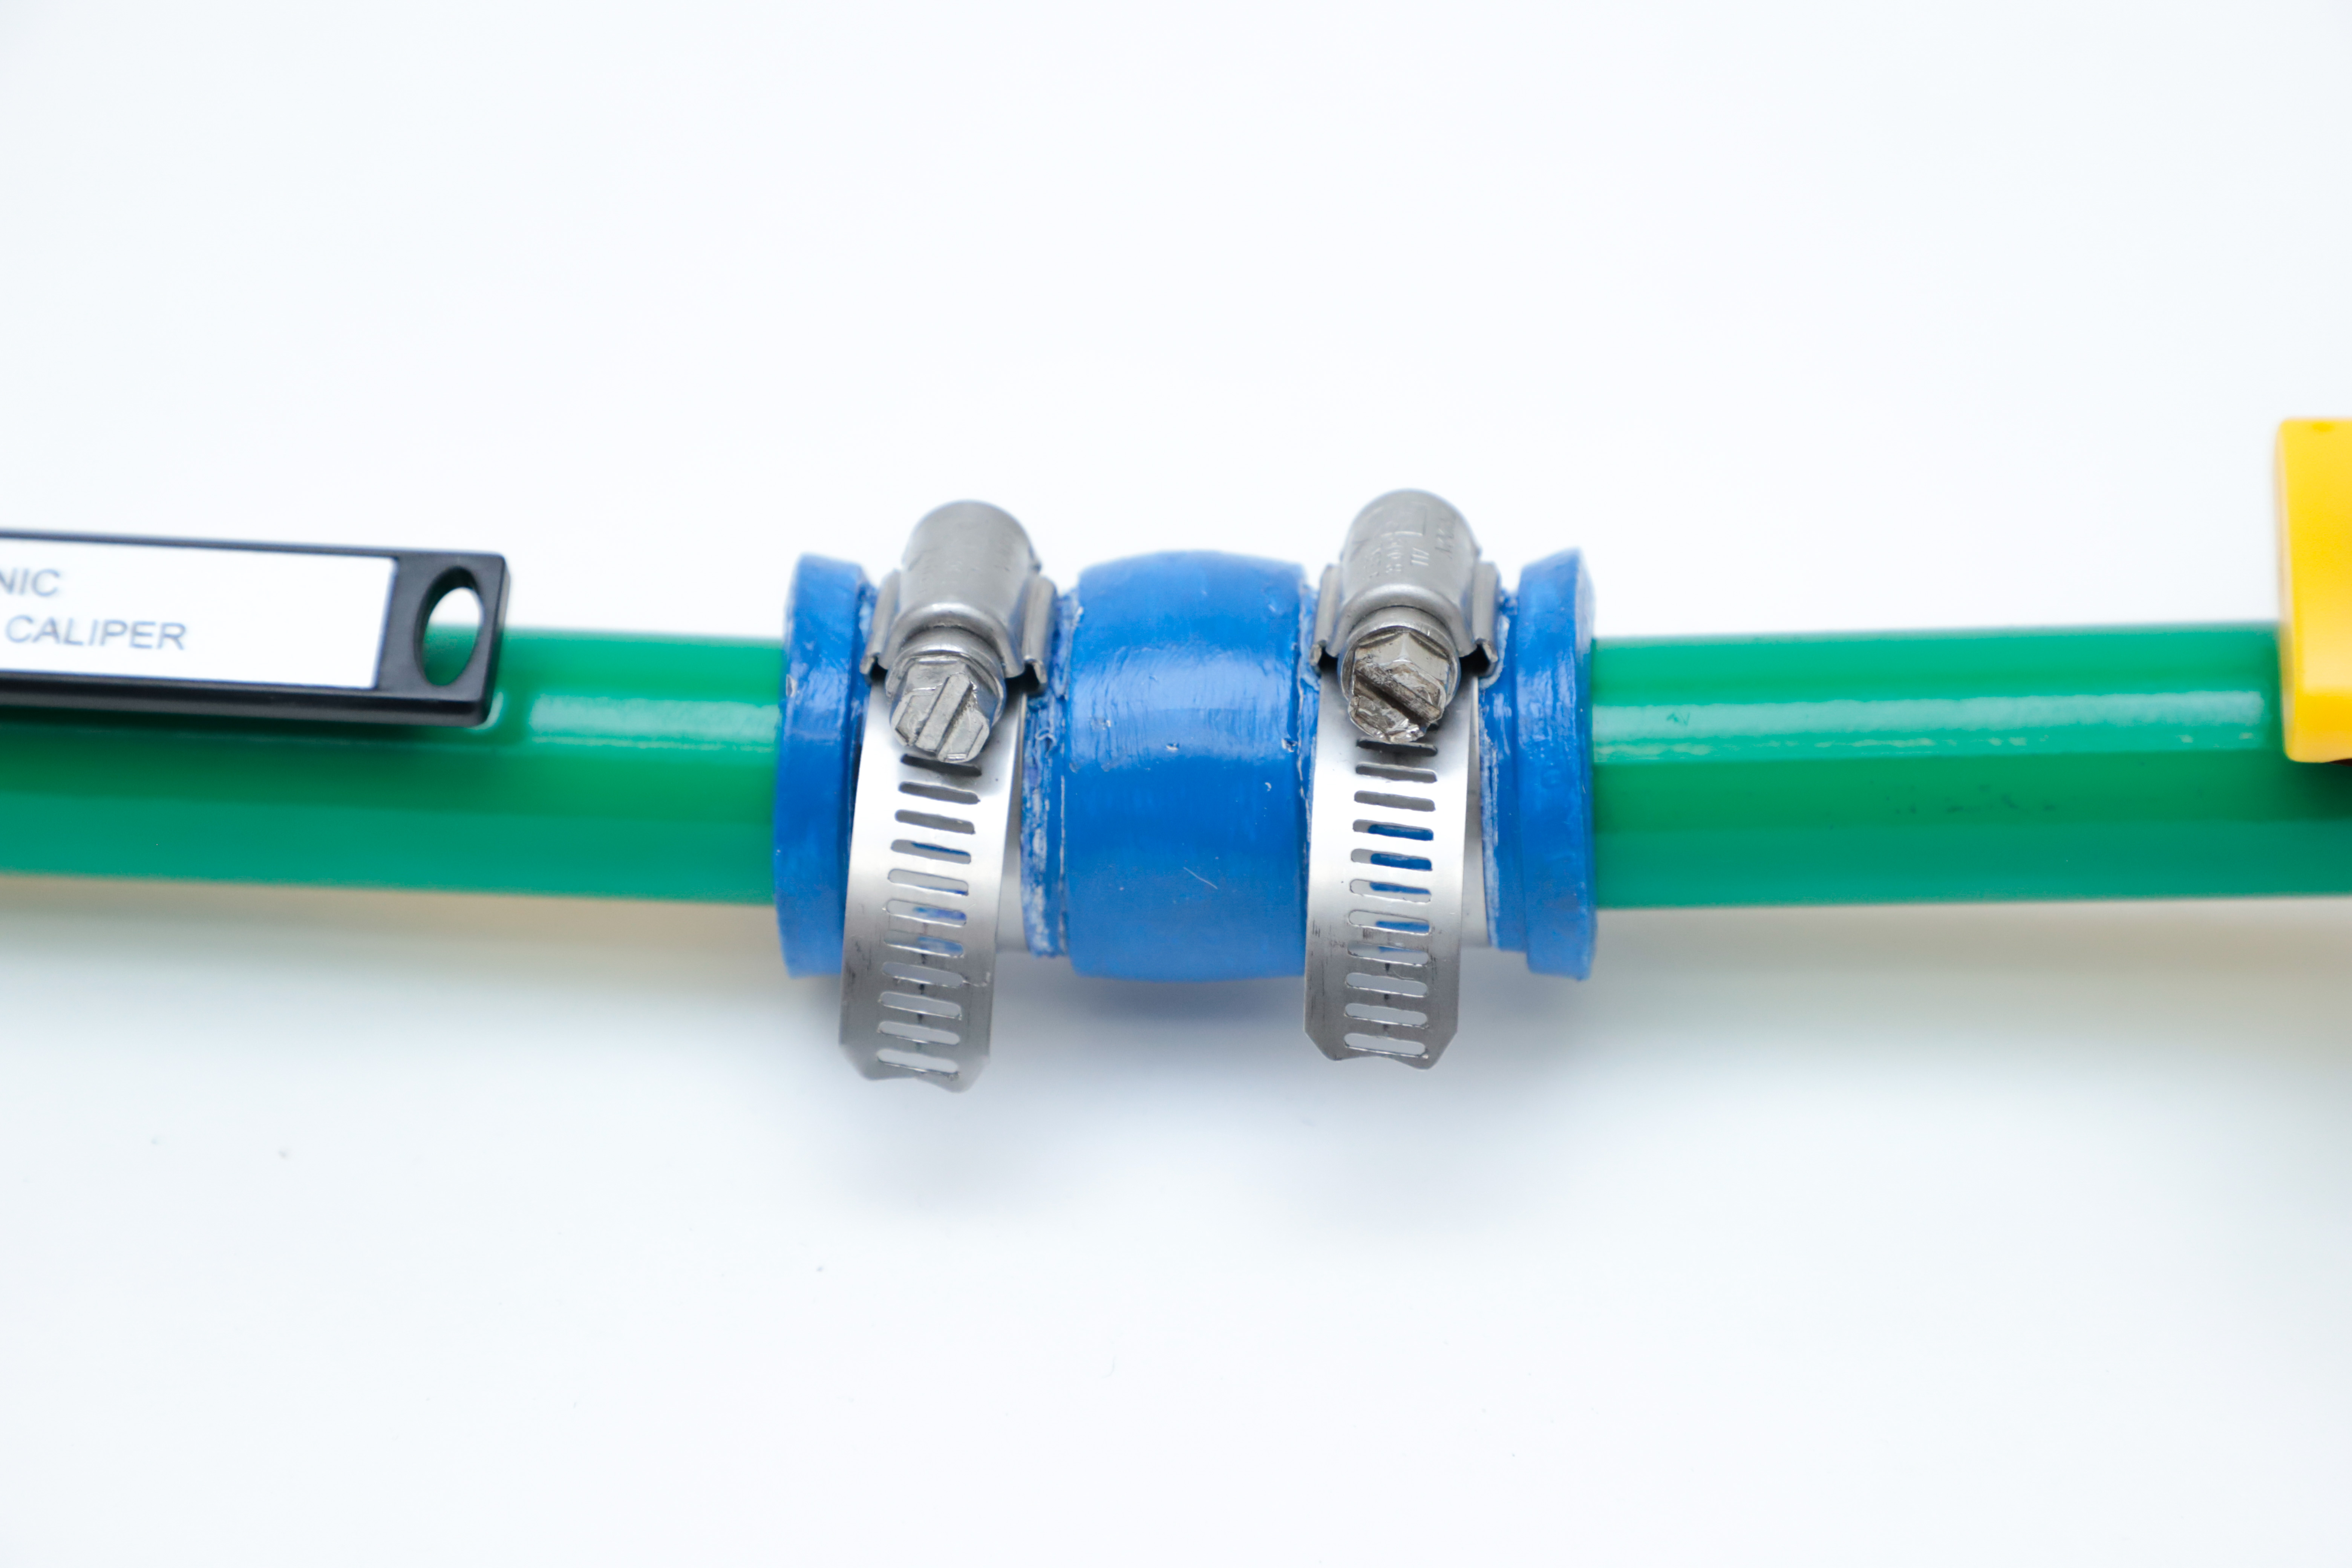
Finding ways to join two metal rods
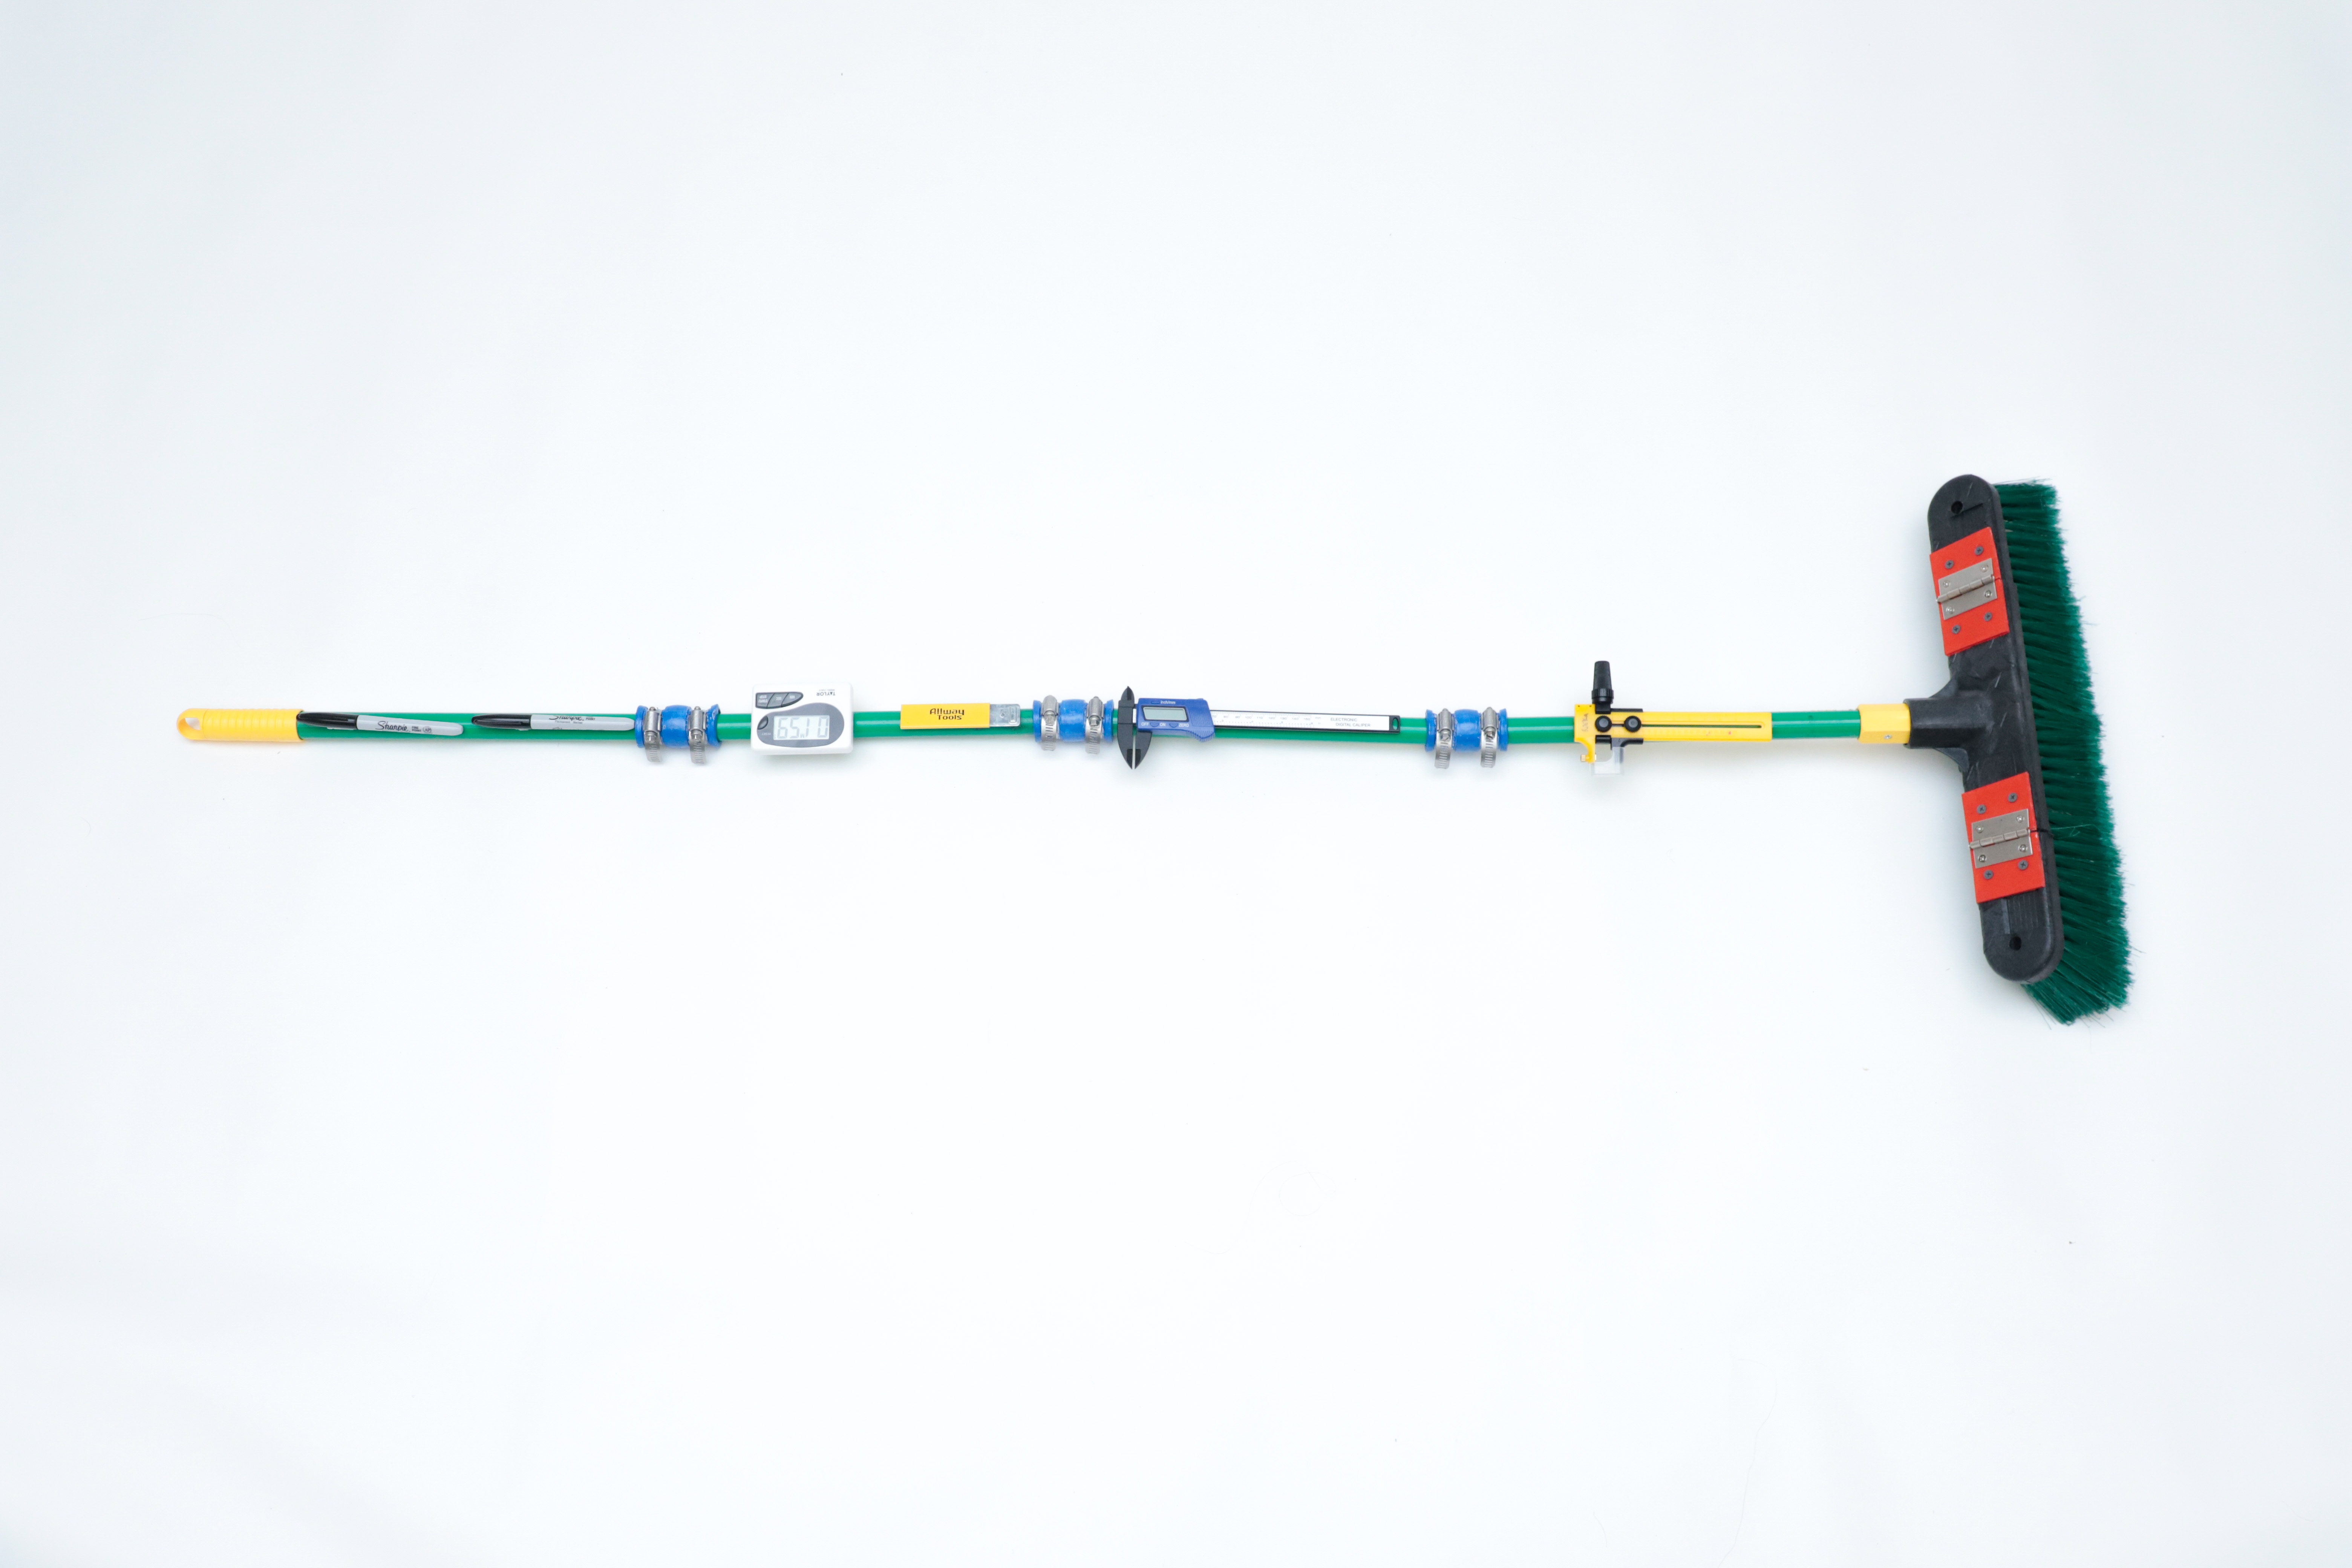
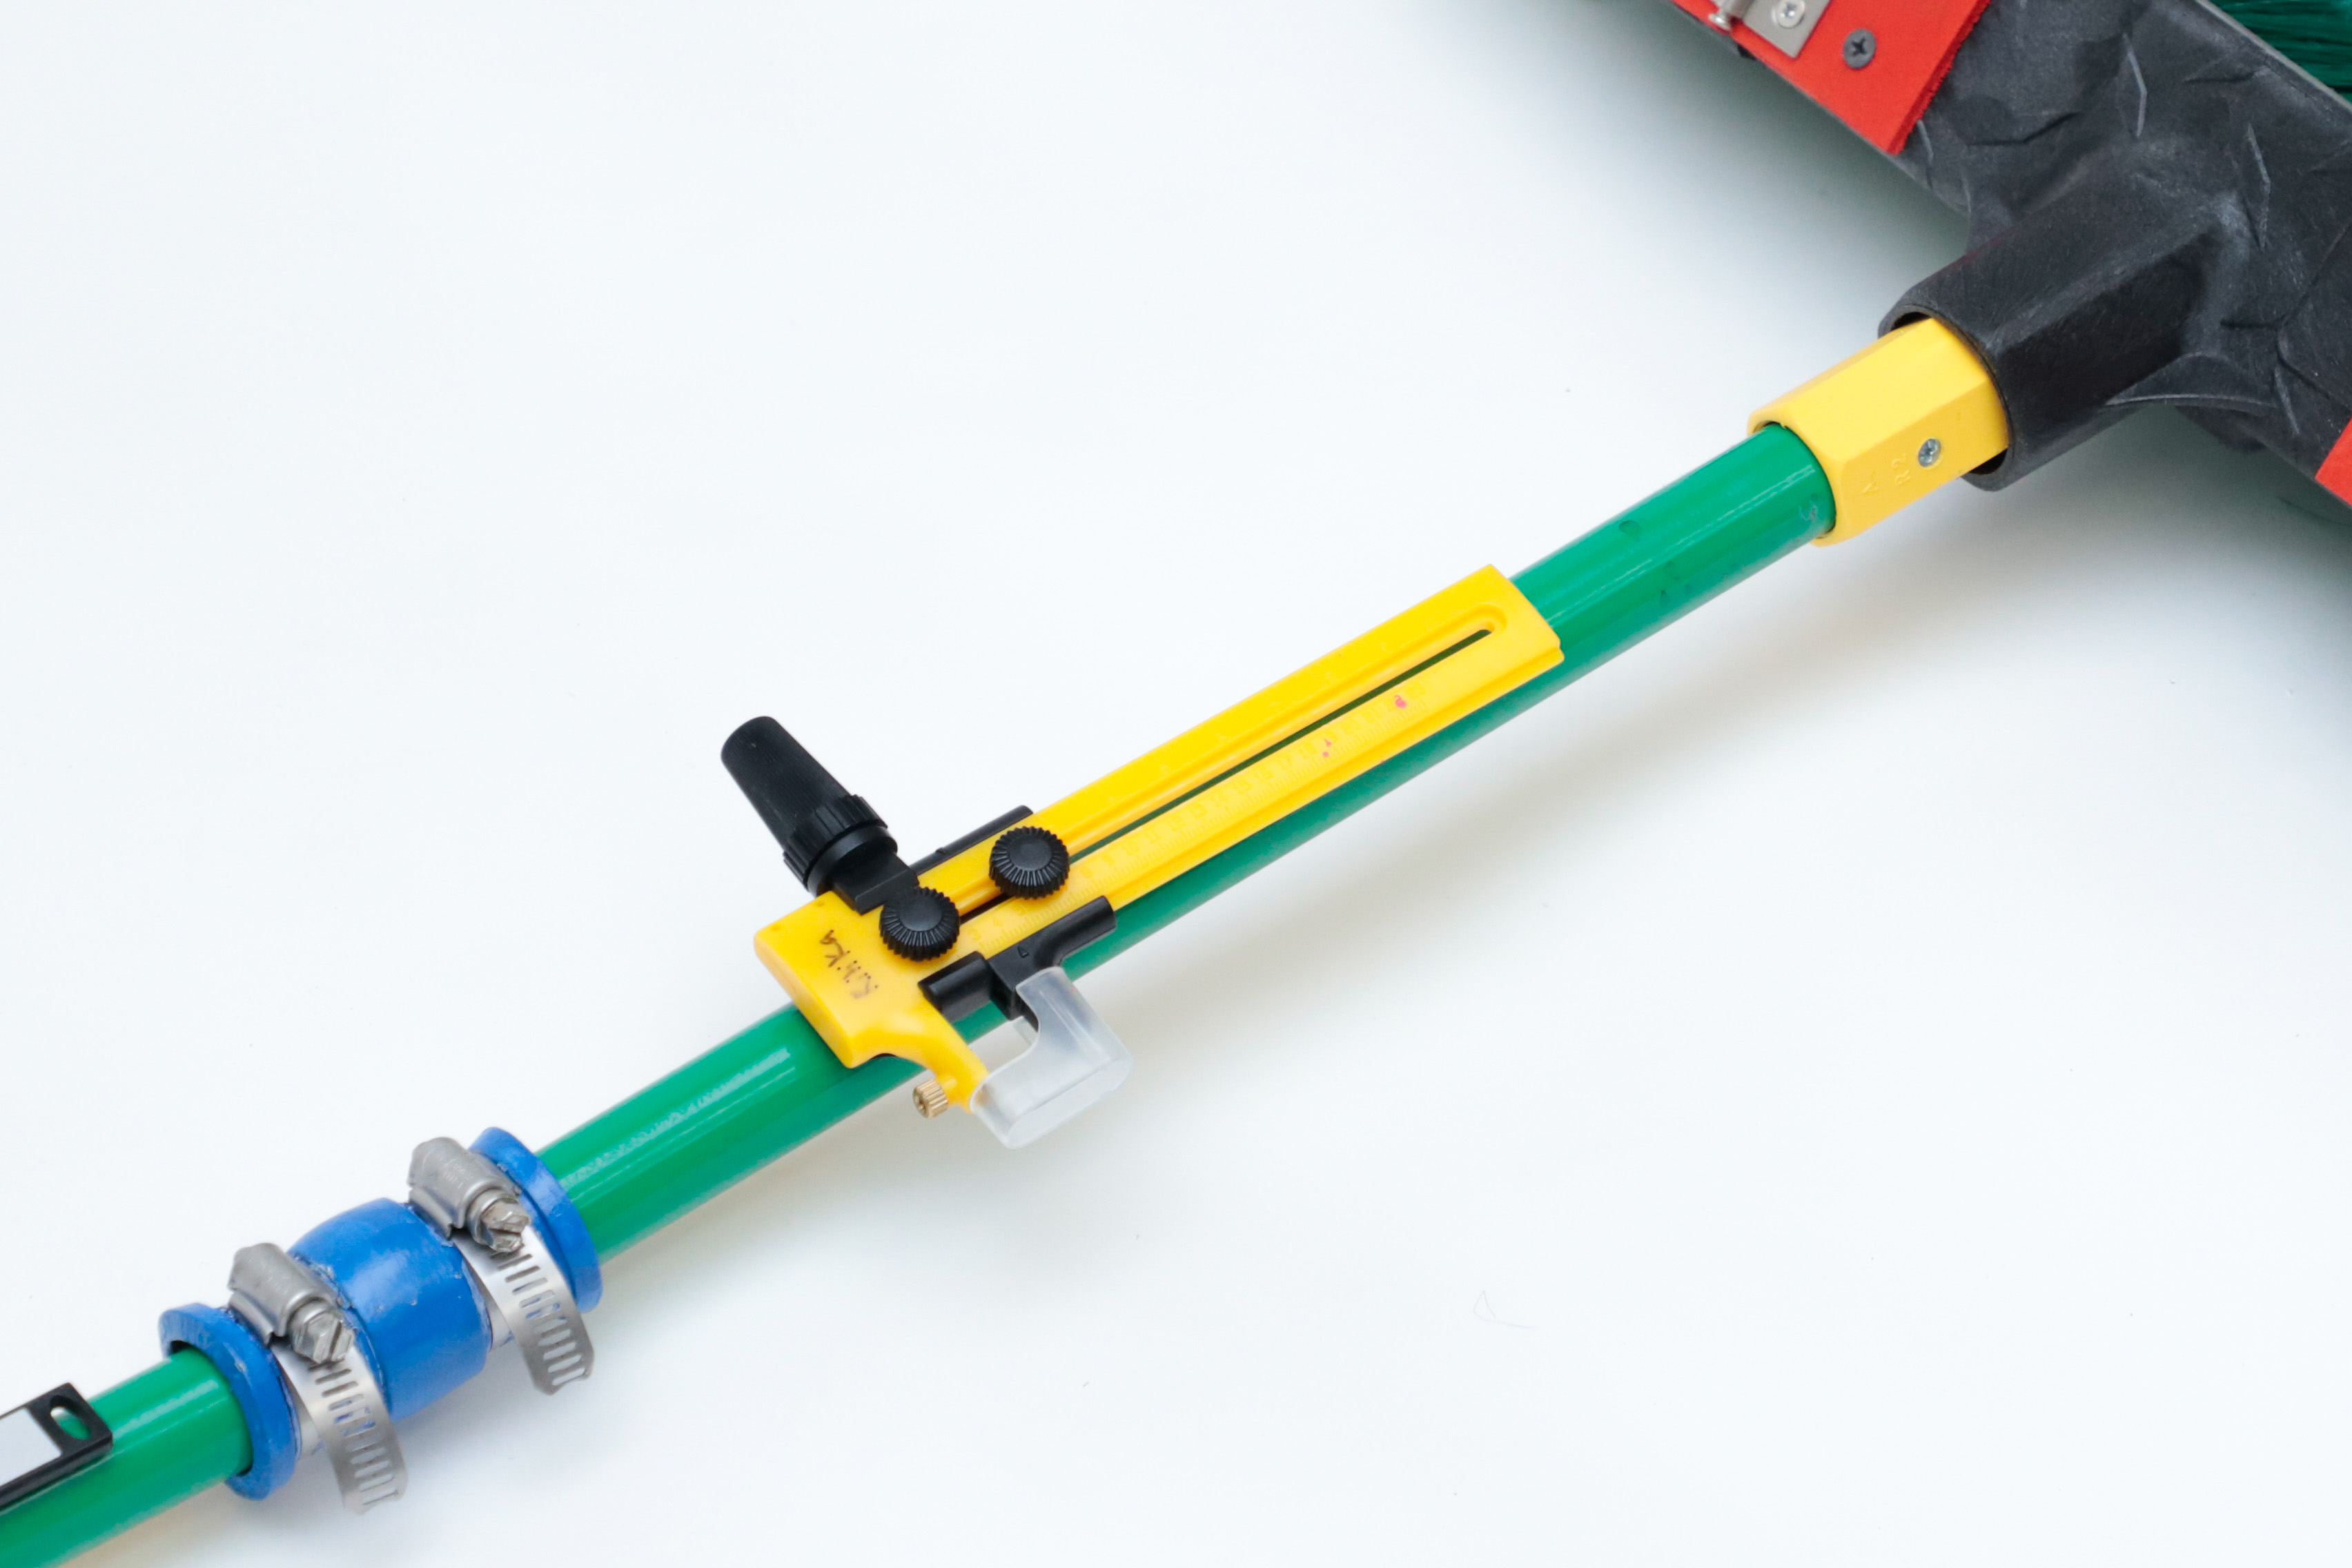
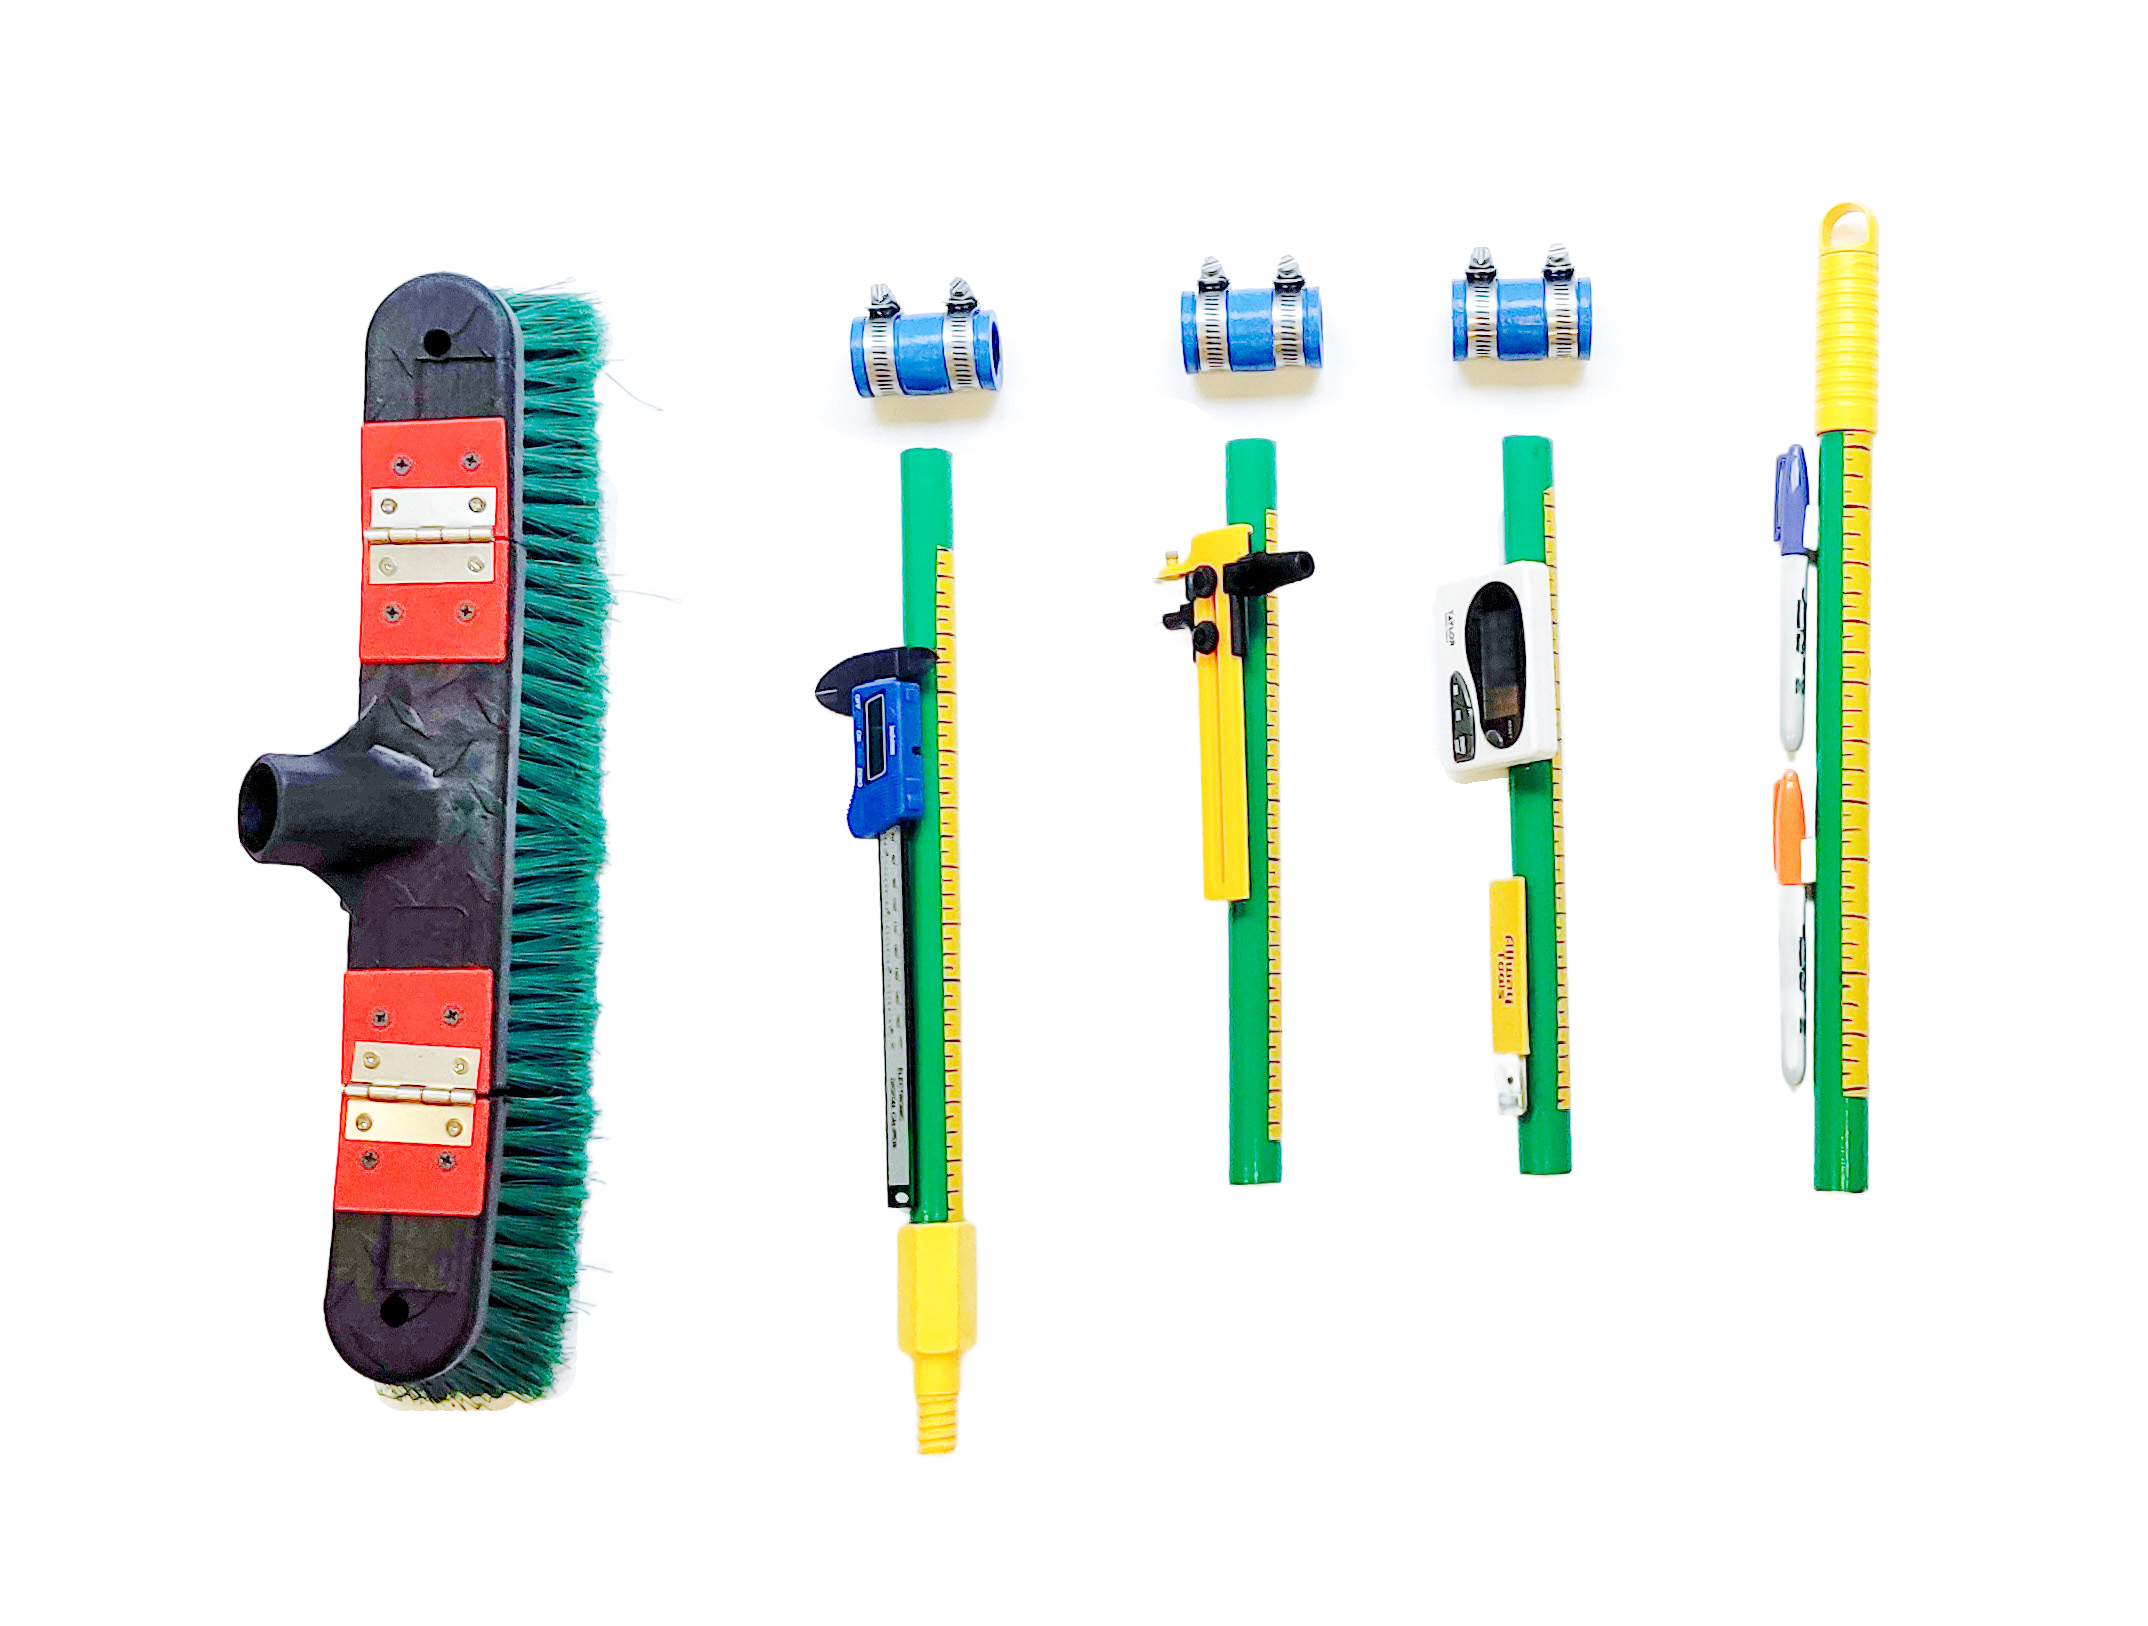
Inputted Variables
In order to control the different variables that are at play when one is sweeping, various measuring probes are engineered into the broom to calculate the factors that affect the way of sweeping and the conditions that are the result of the sweeping. 8 variables can be experimented with, creating a total of 56 possible research opportunities.
1. Height of broom stick
2. Number of hair bristles
3. Sweep stroke tracking sharpies
4. Time of cleanliness

5. Dust circle cutter
6. Dust circle vernier caliper
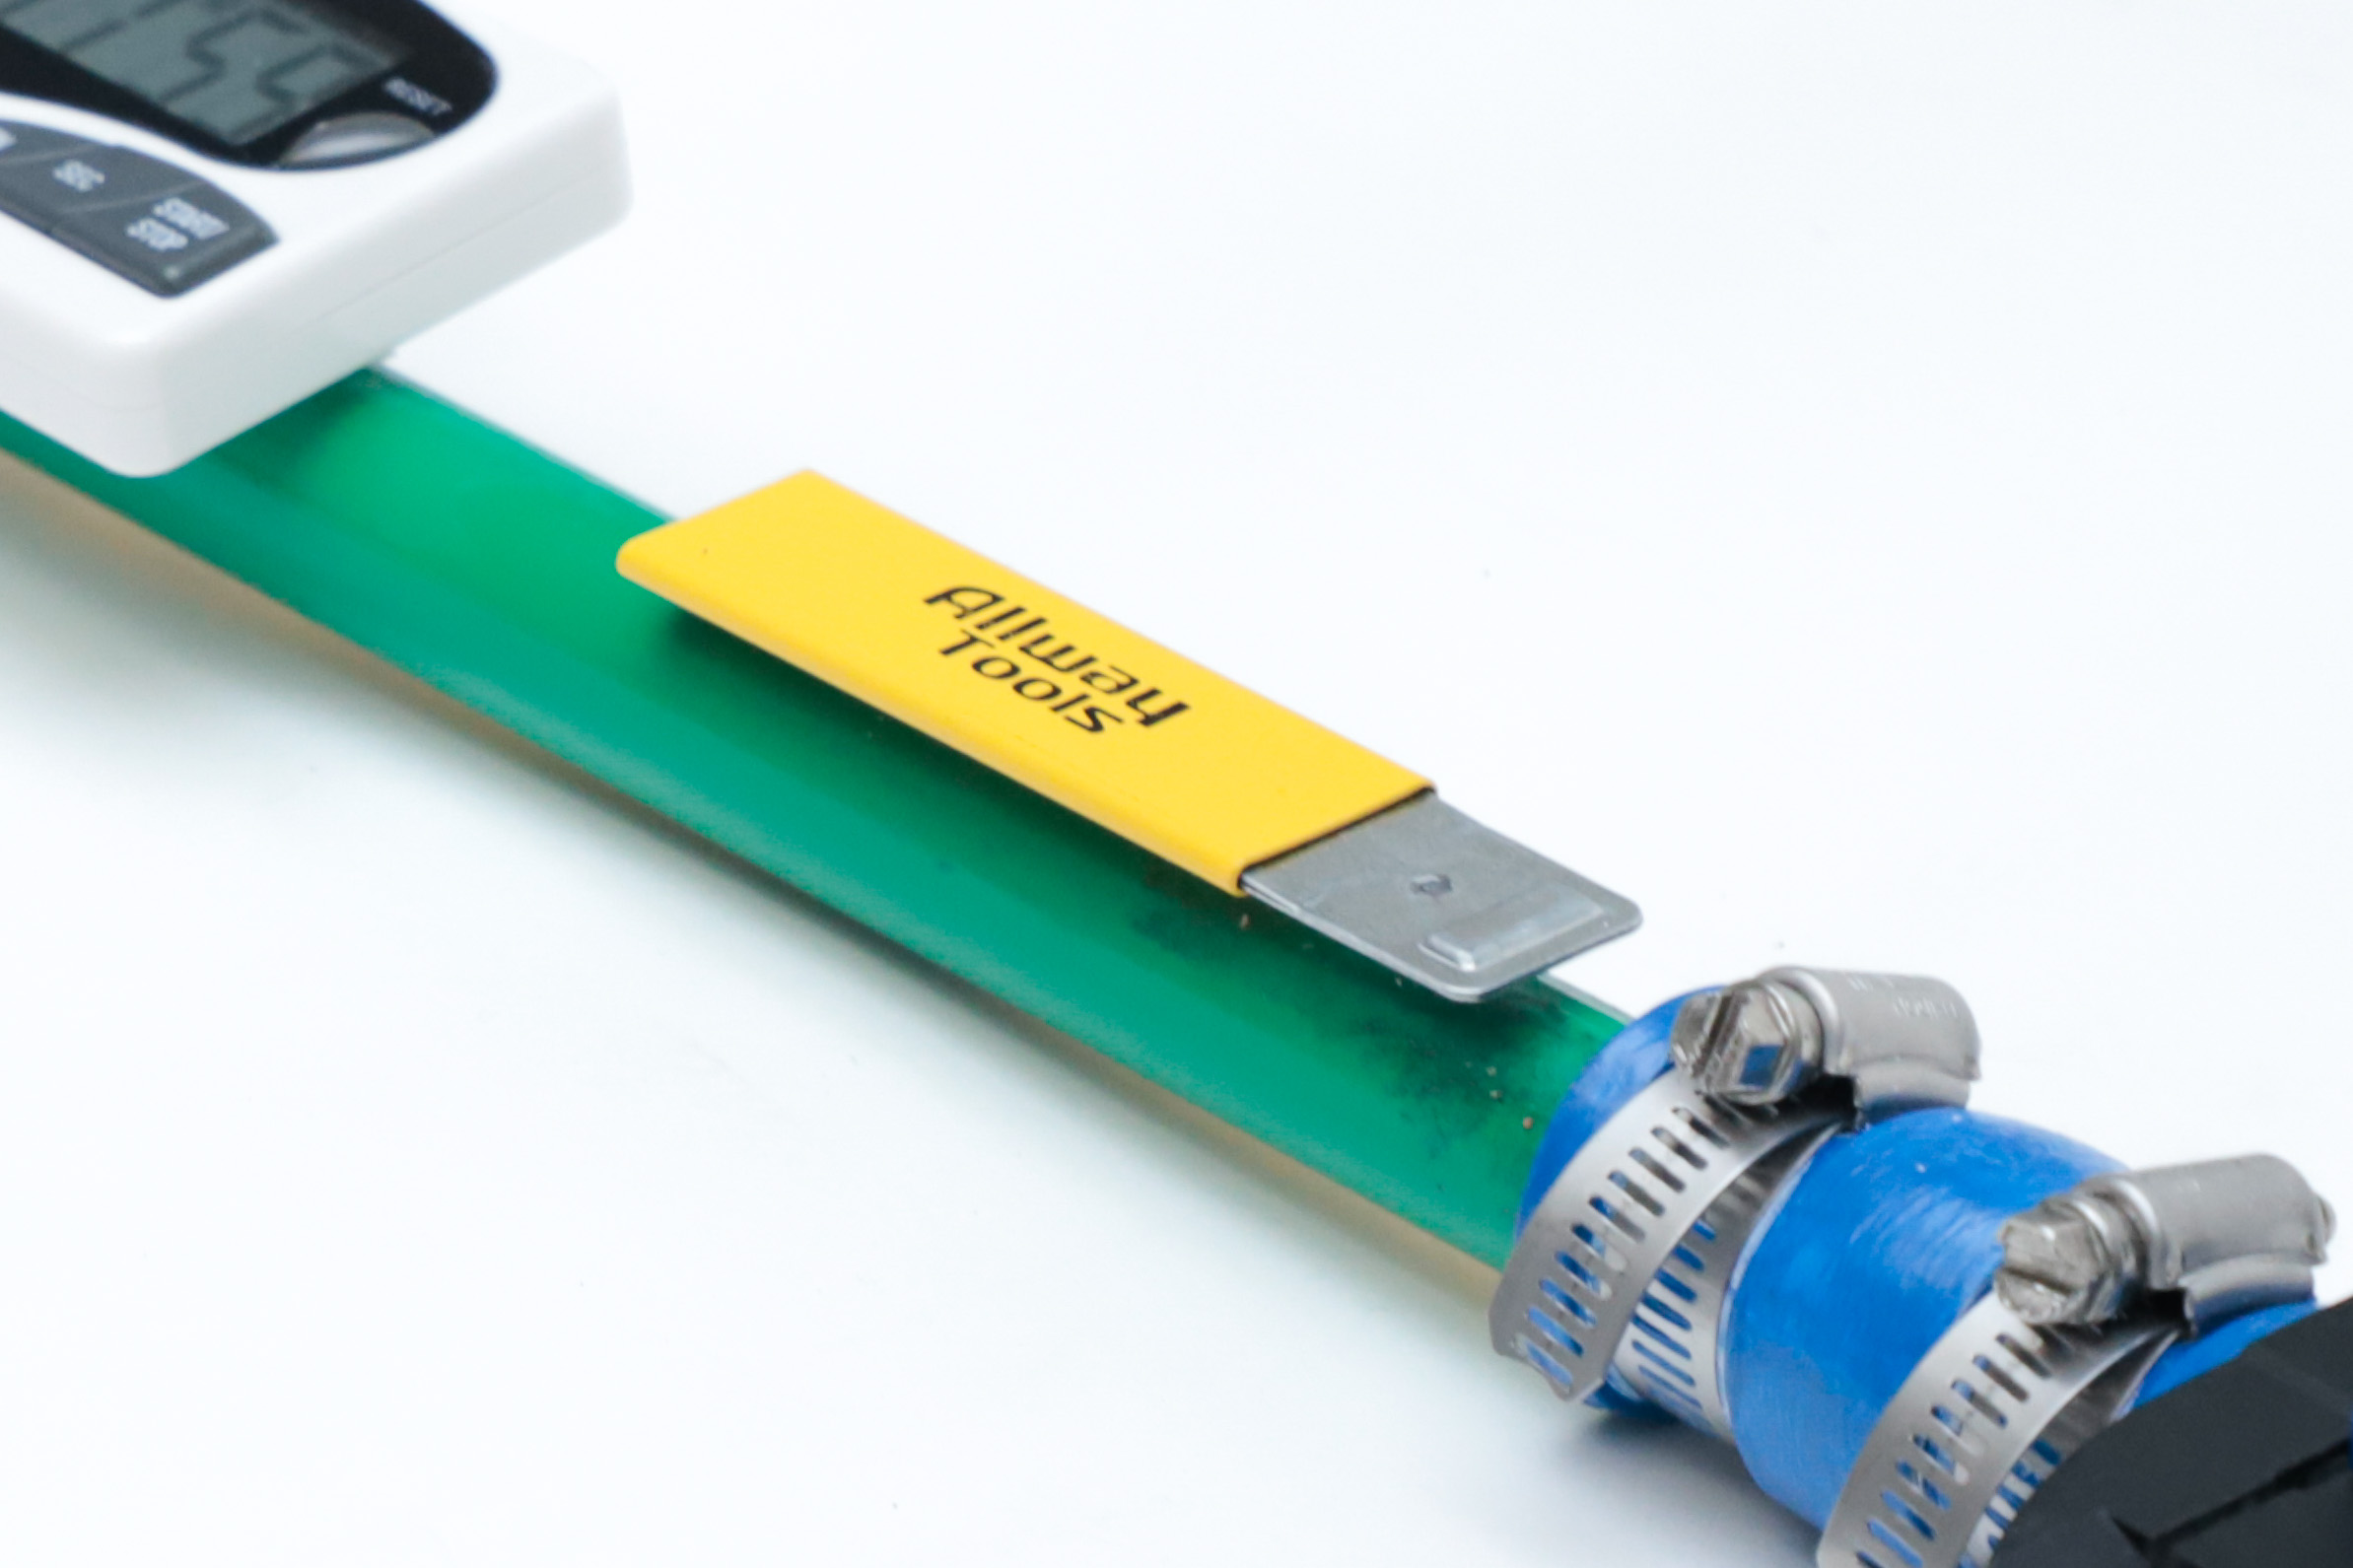
7. Gum scraper count keeper
8. Measuring Ruler Handle

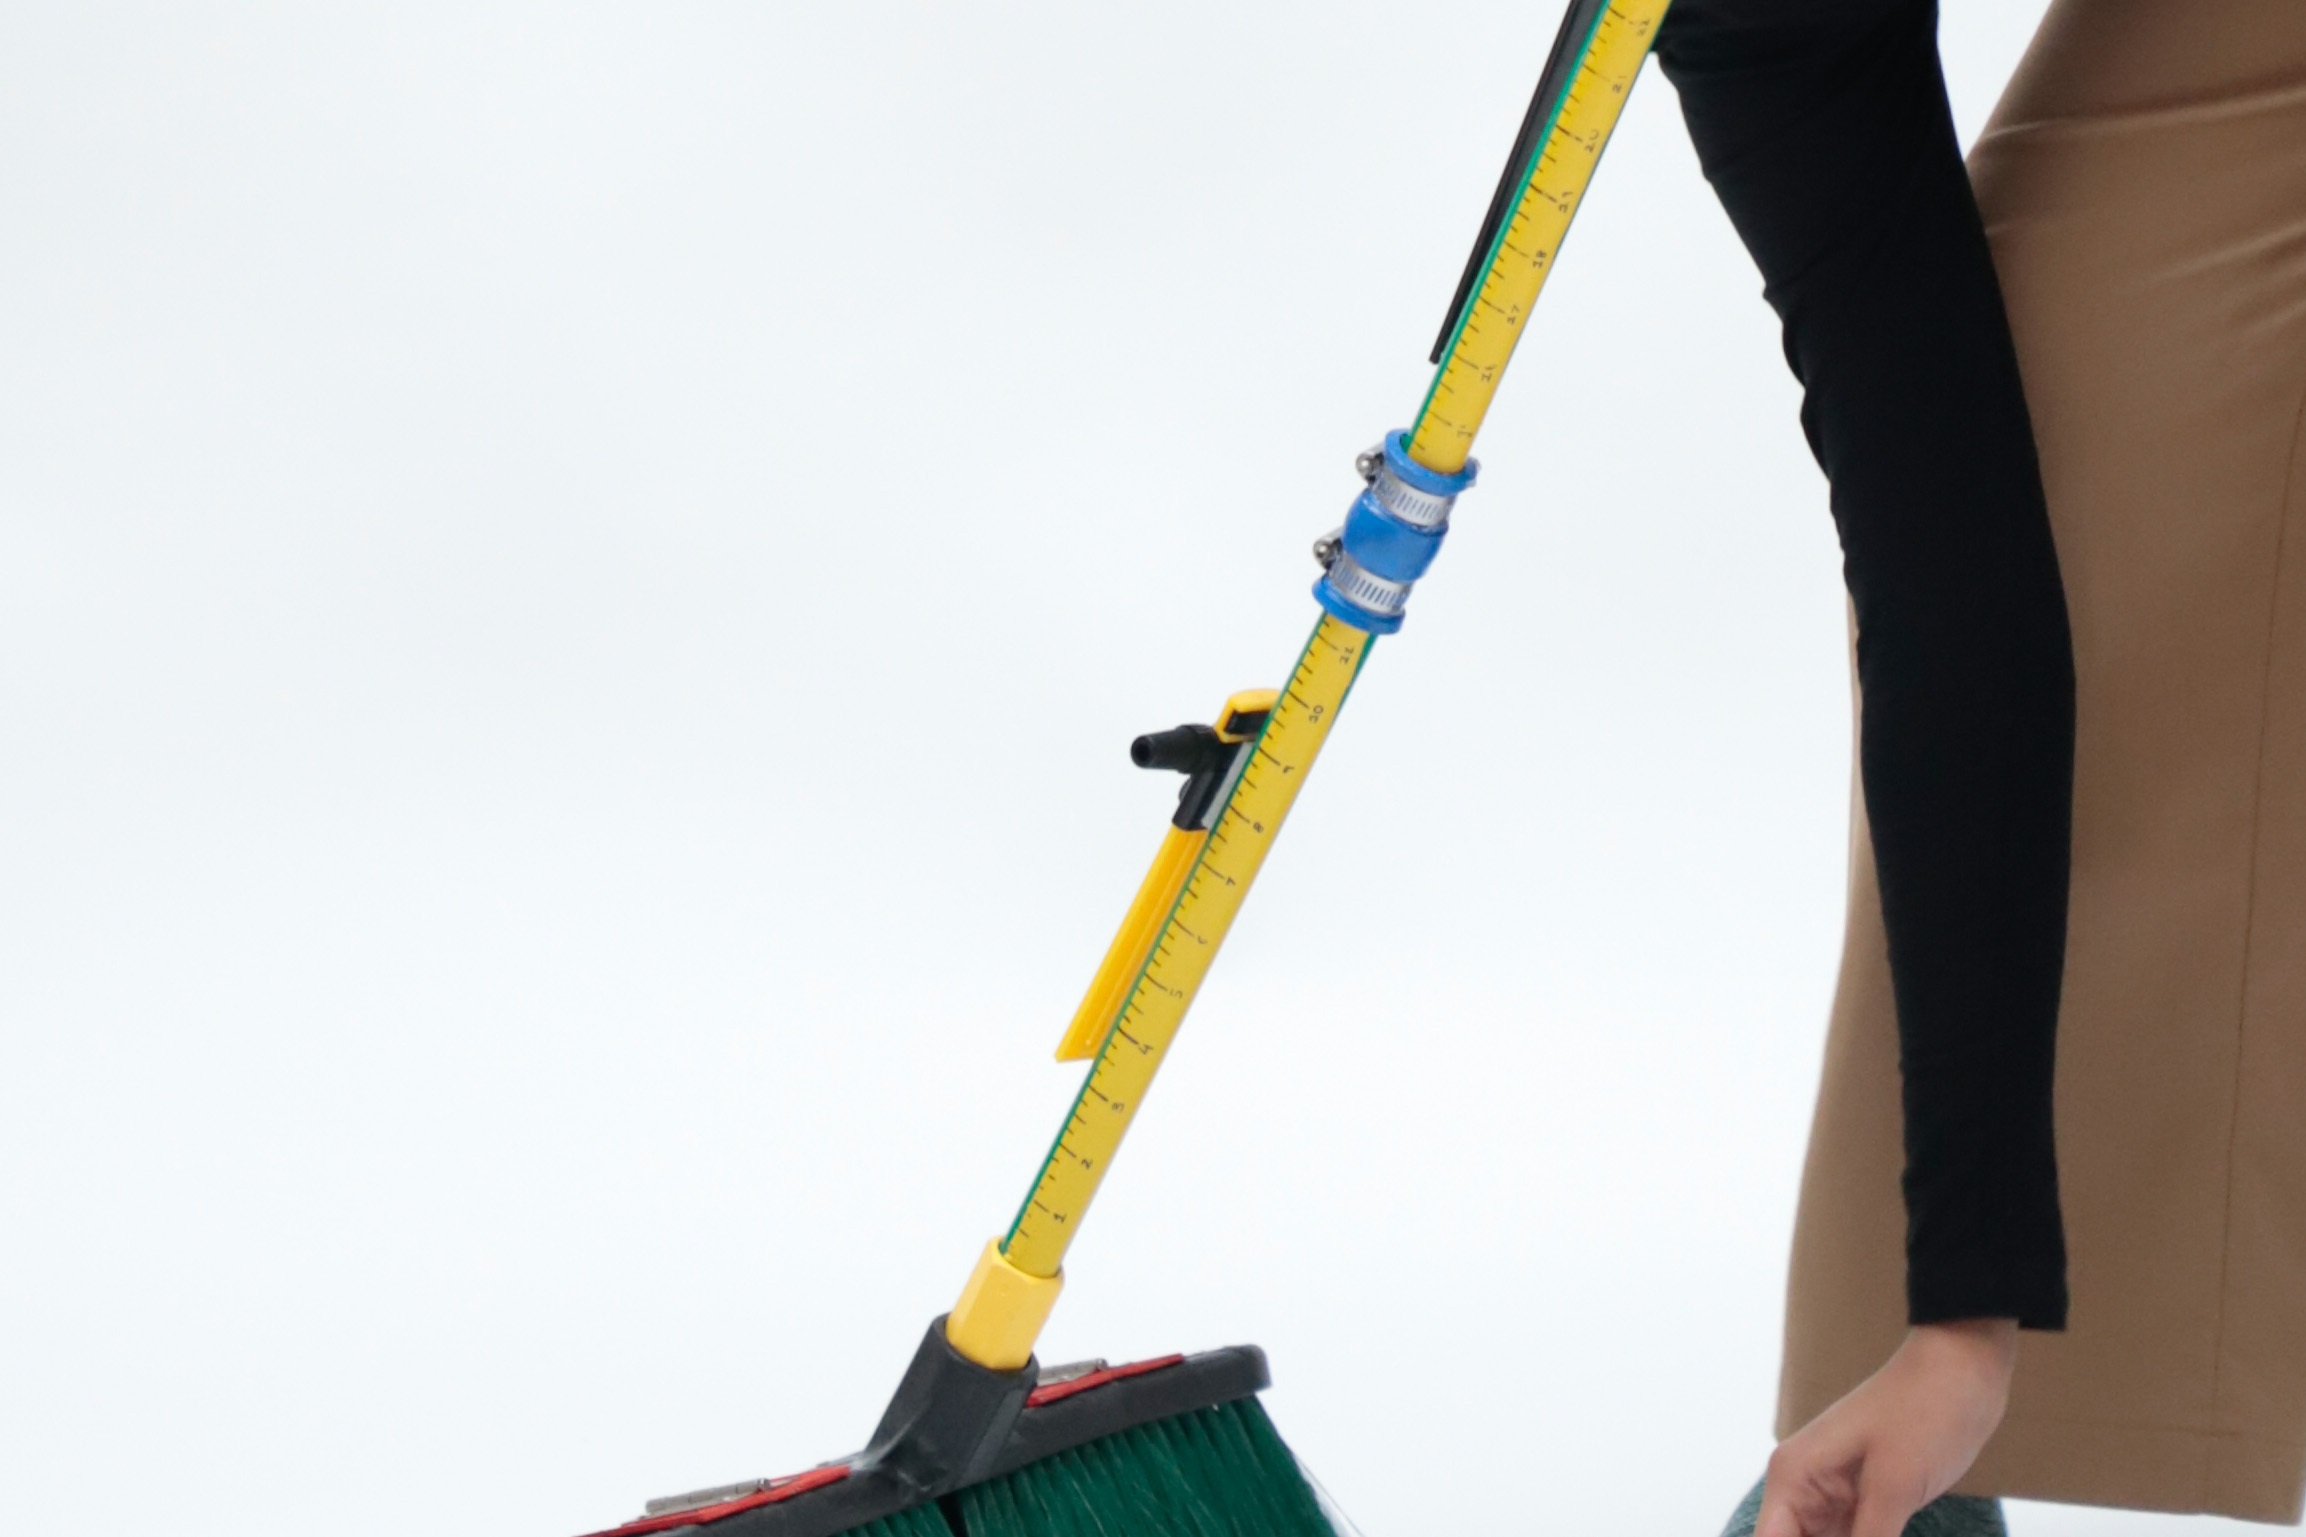
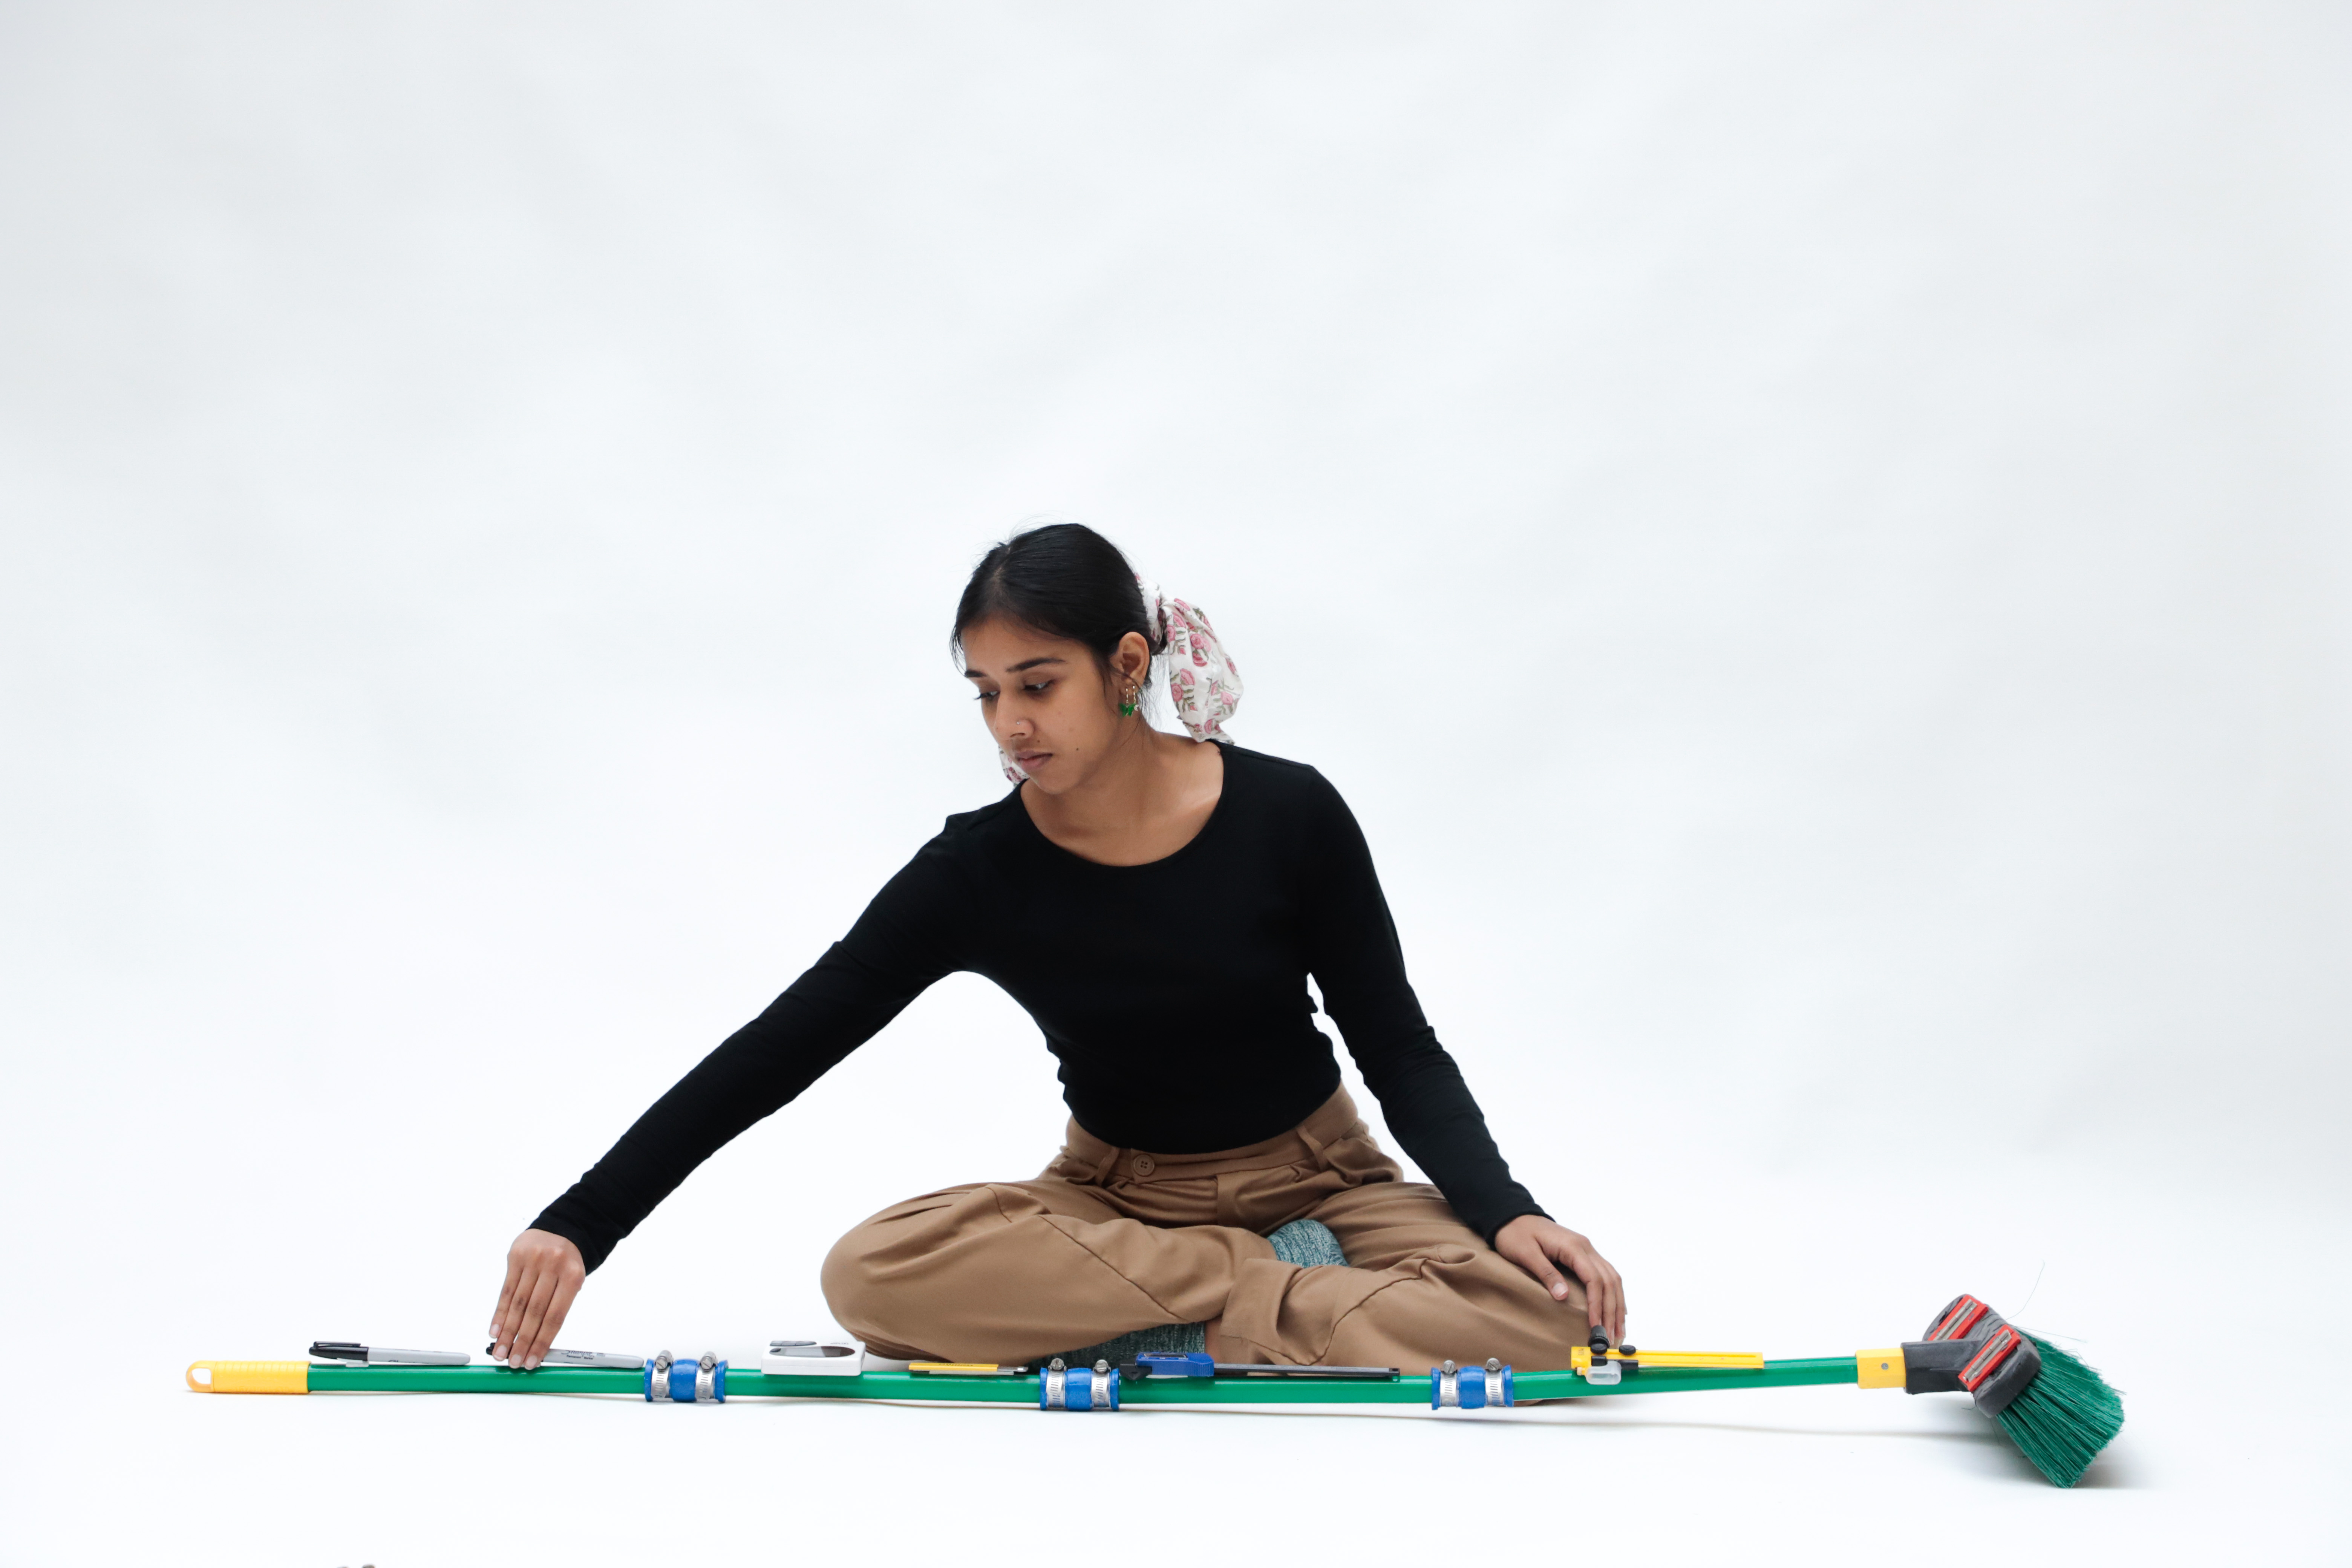
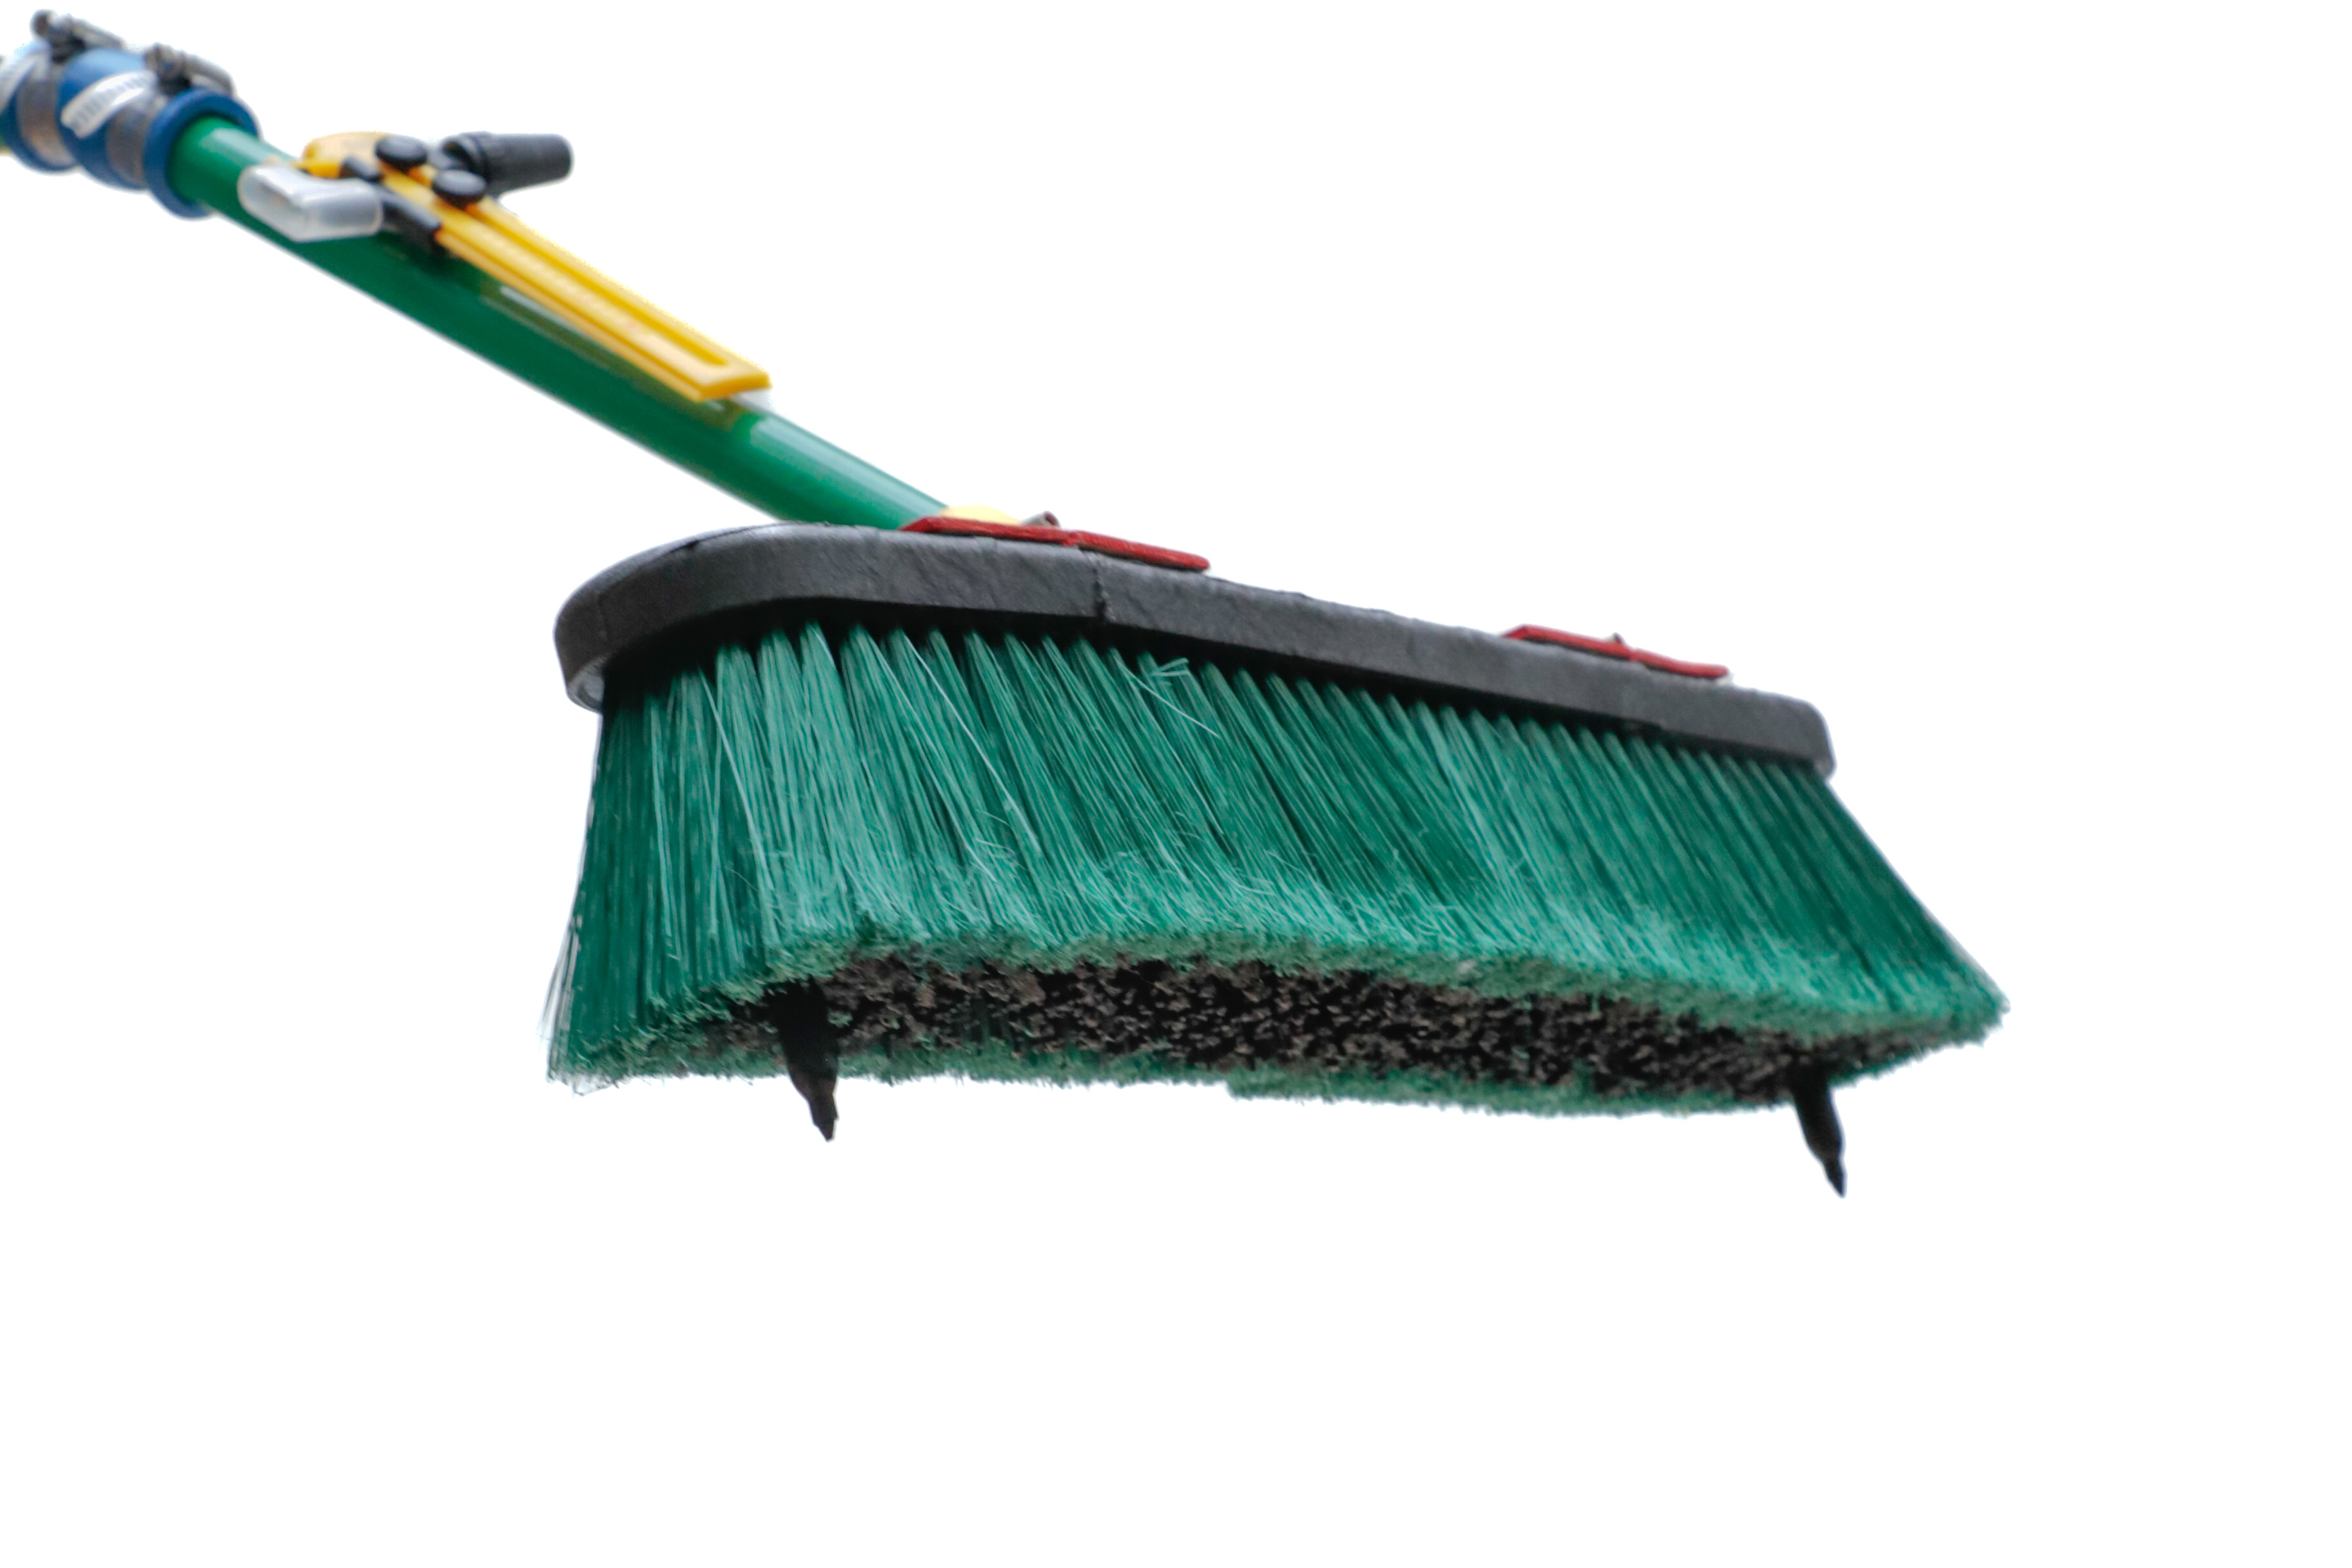
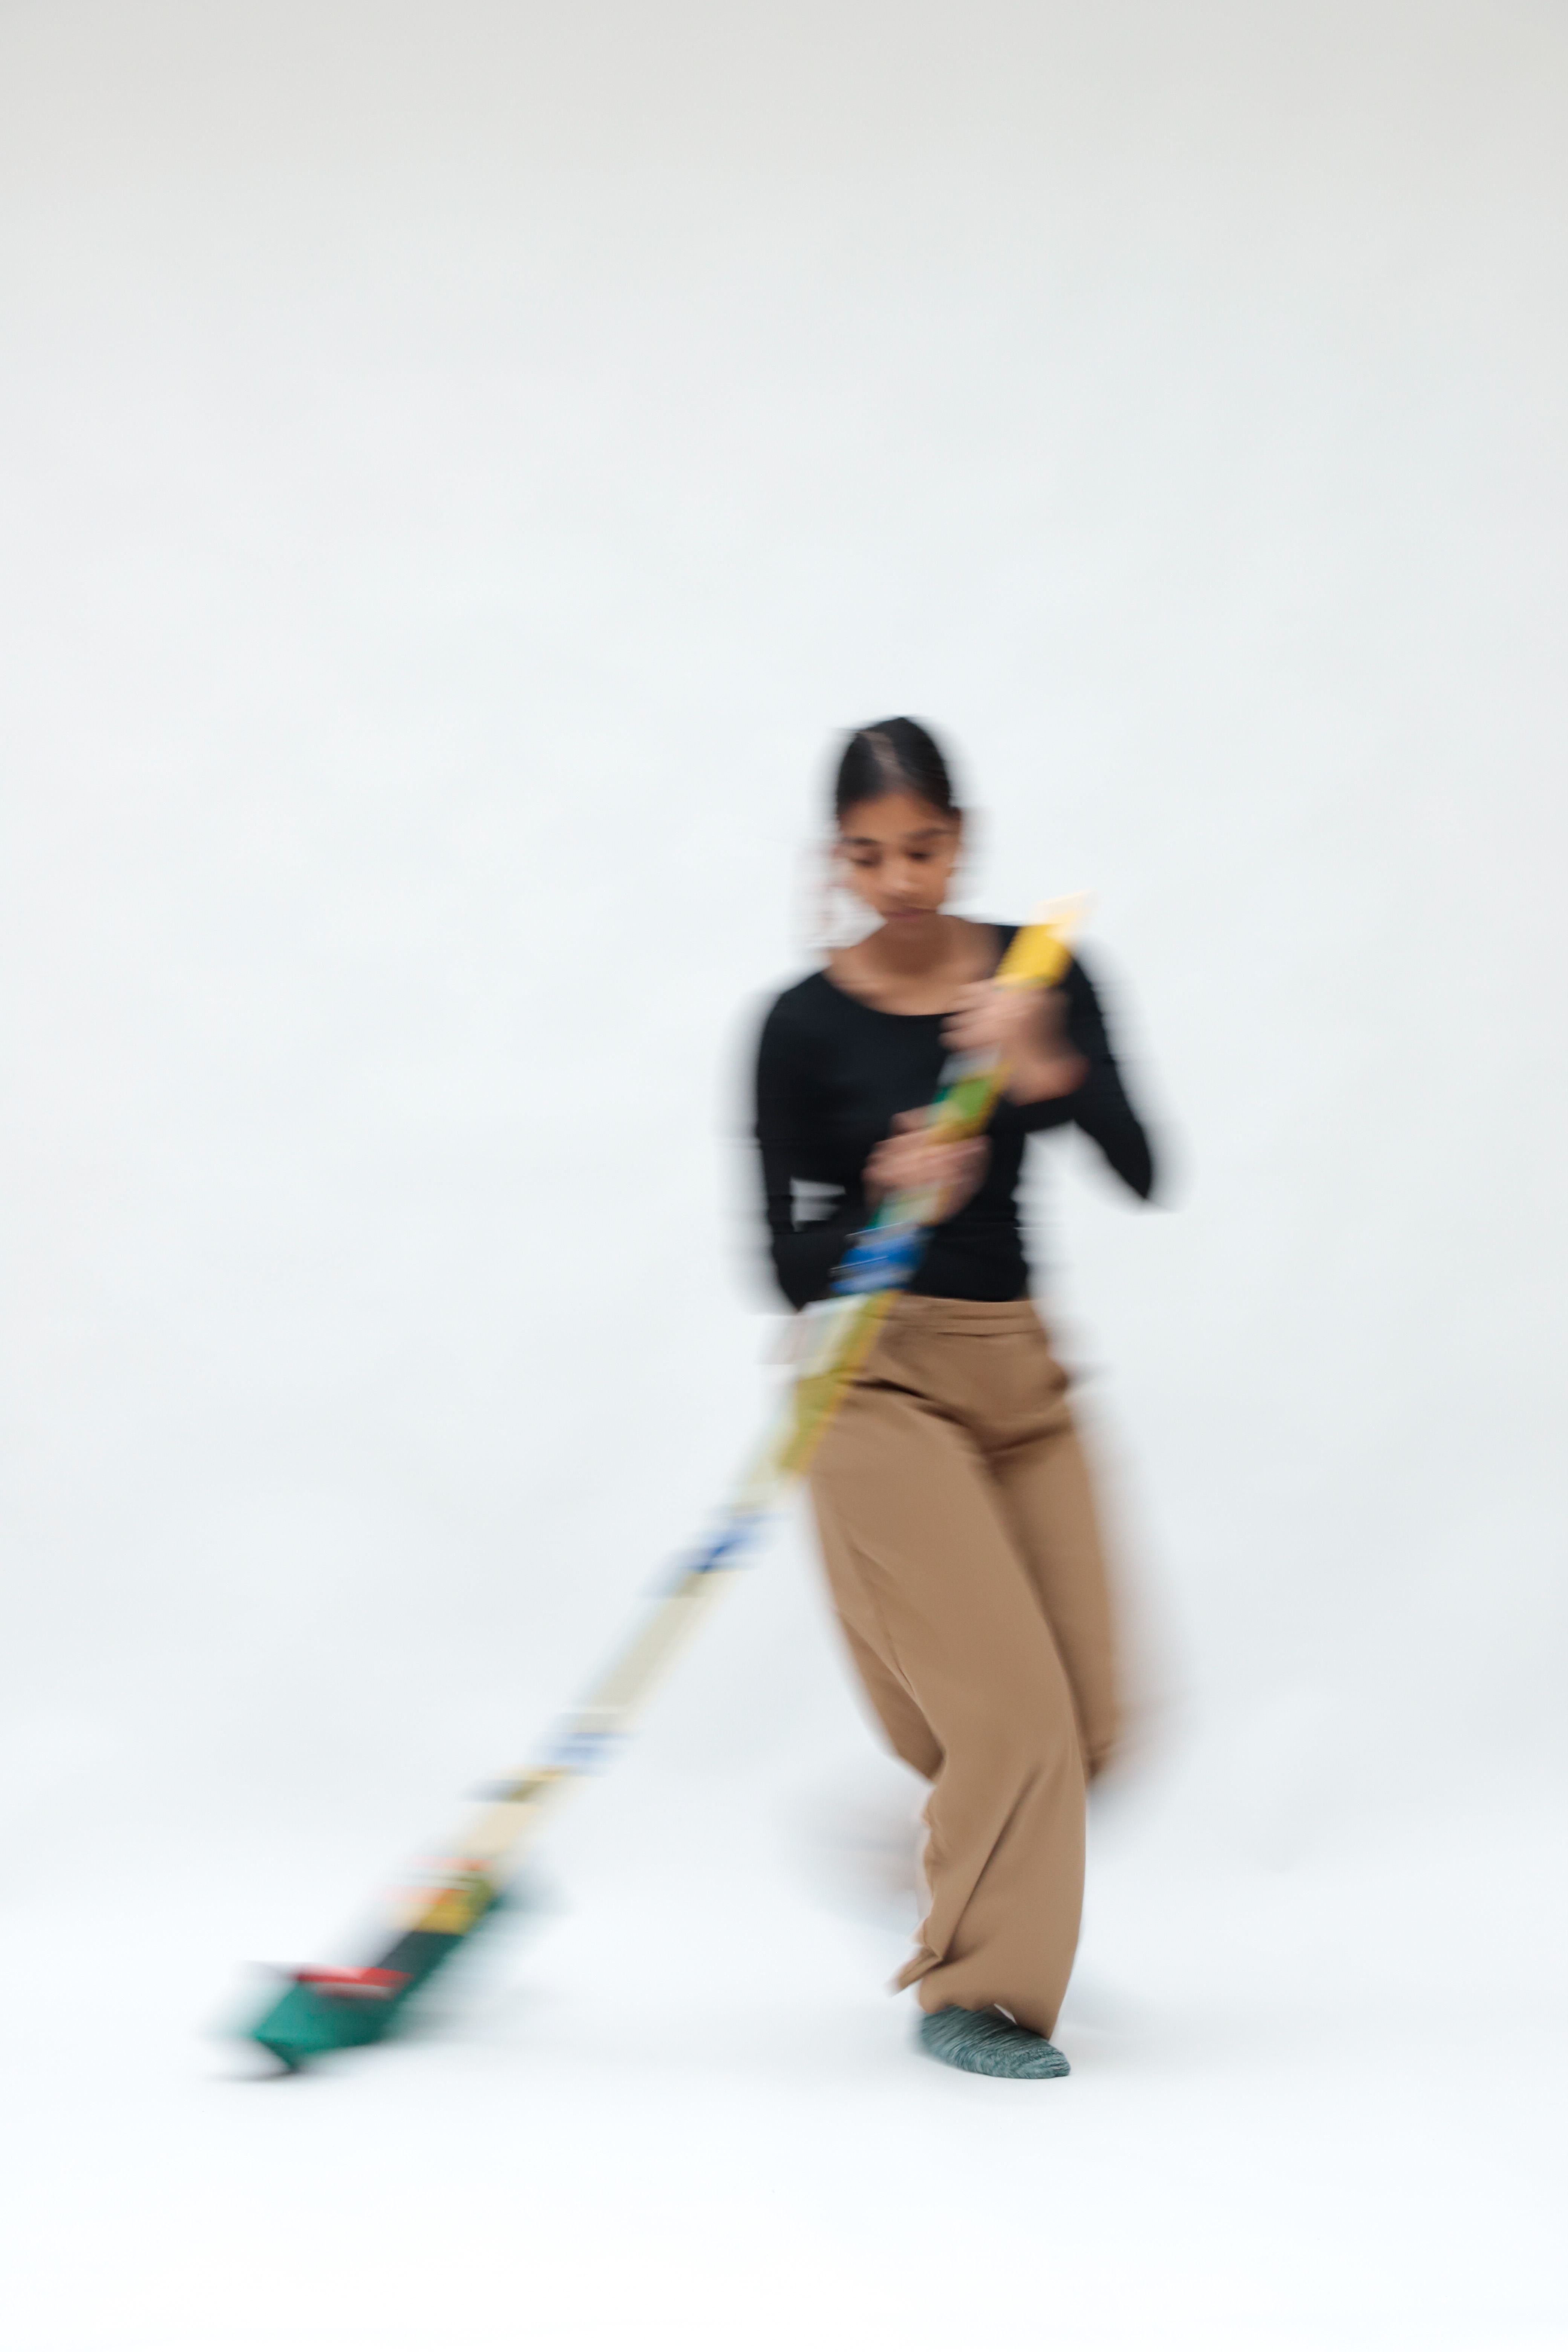
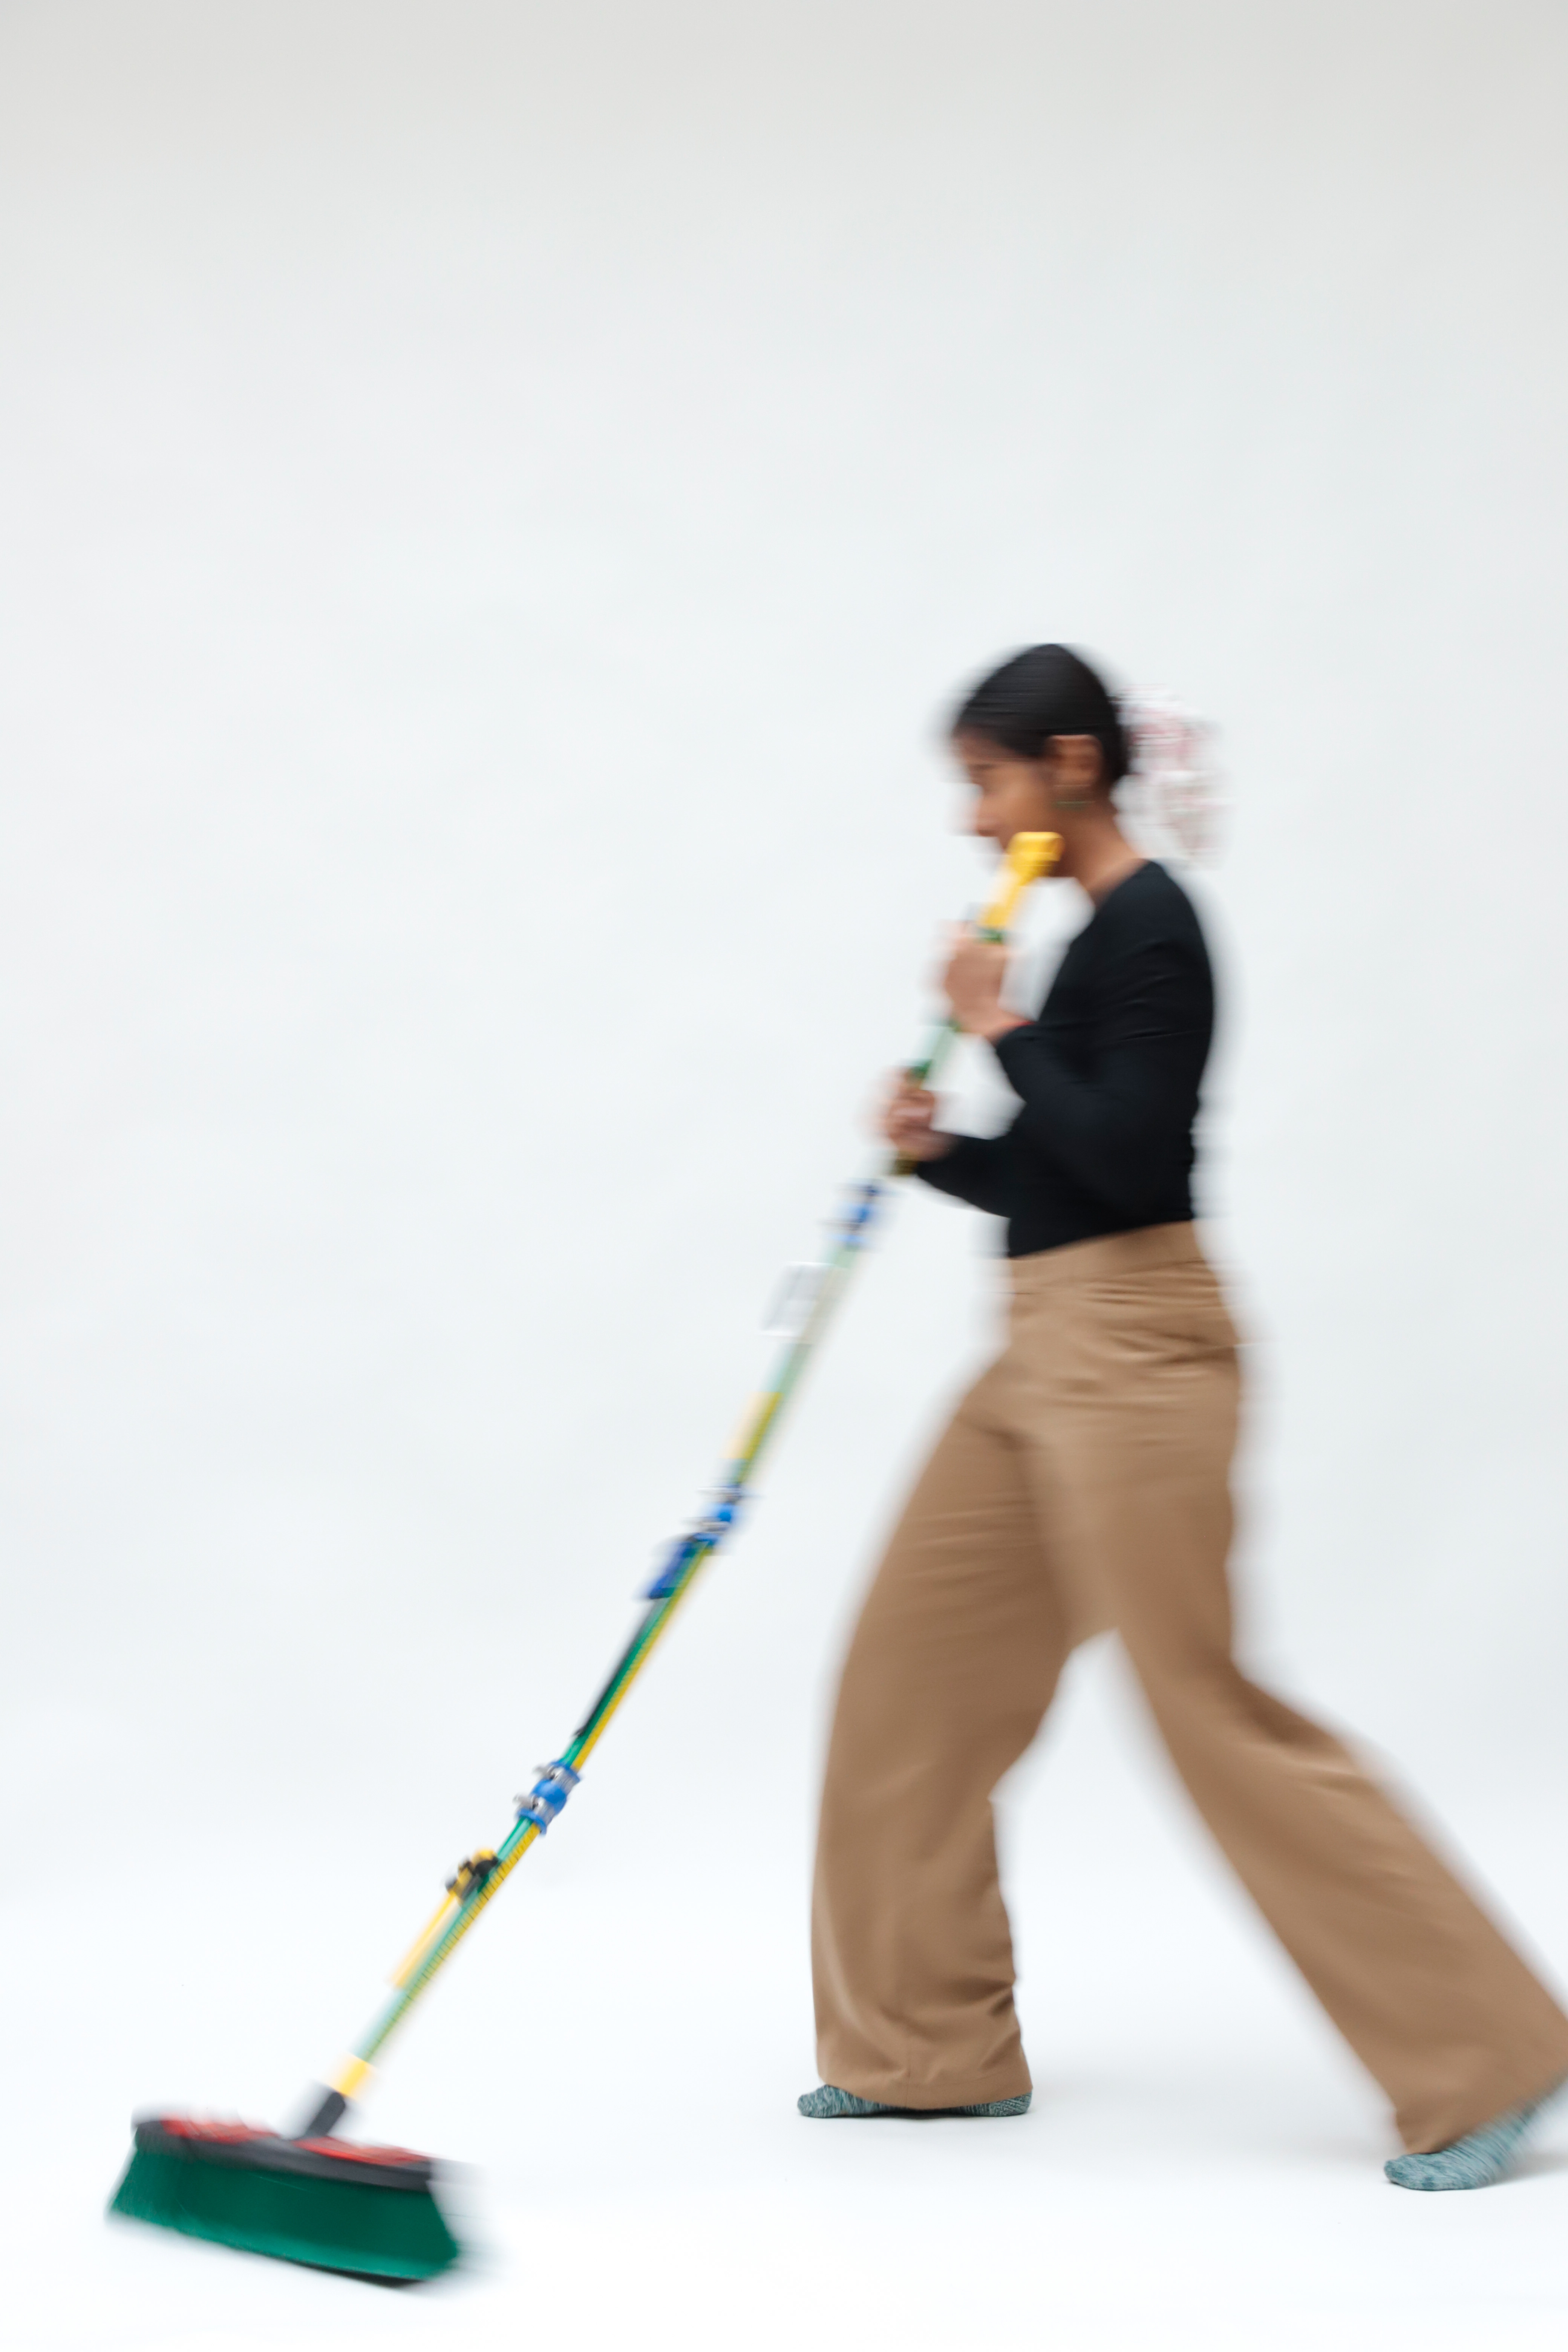
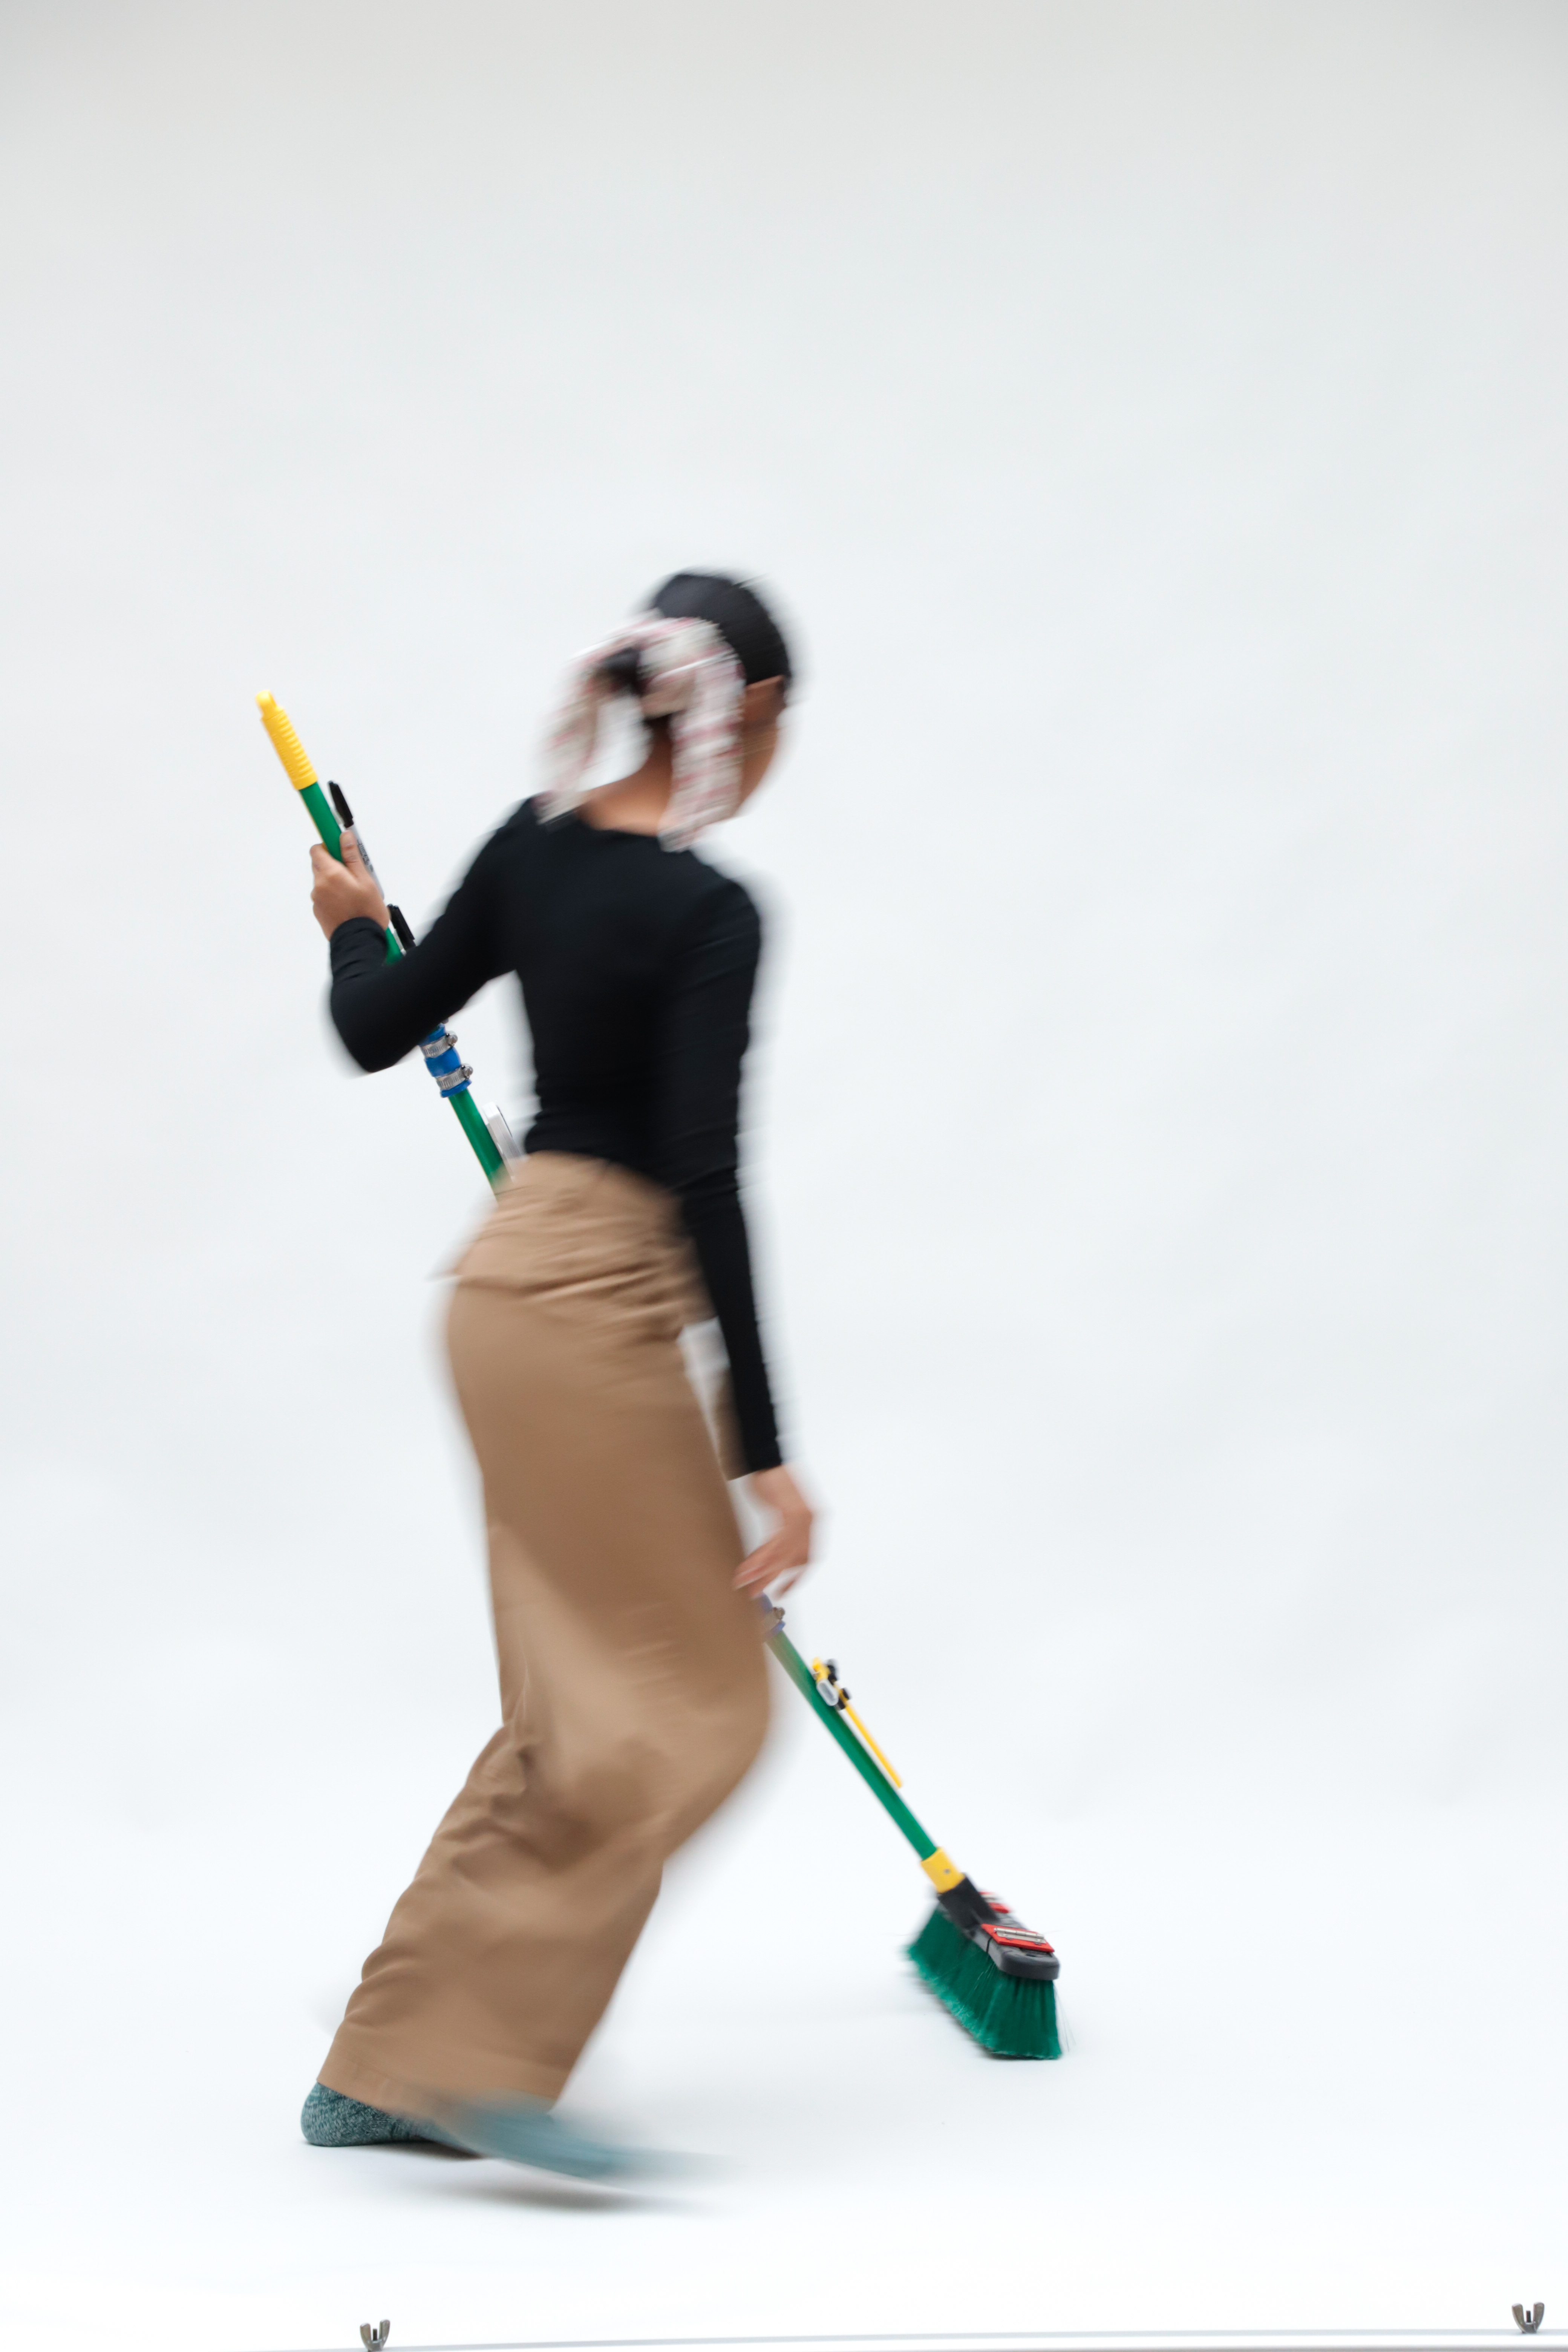
Final Apparatus
Challenging the sterile nature of standard scientific testing equipment, this brightly colored broom-turned-apparatus also defies the order of scientific reasoning by building apparatus before research objectives, by making before thinking.
PHASE 2: EXPERIMENT
Research Question
How does the pattern of sweeping, ie. the number or strokes, affect the area of the dust circle created given that all other variables are constant?
Constants
Time of sweep = 40 seconds
Height of broom handle = 48in (maximum height)
Number of broom hair bristles = 30,000 (all available)
Constants
Time of sweep = 40 seconds
Height of broom handle = 48in (maximum height)
Number of broom hair bristles = 30,000 (all available)
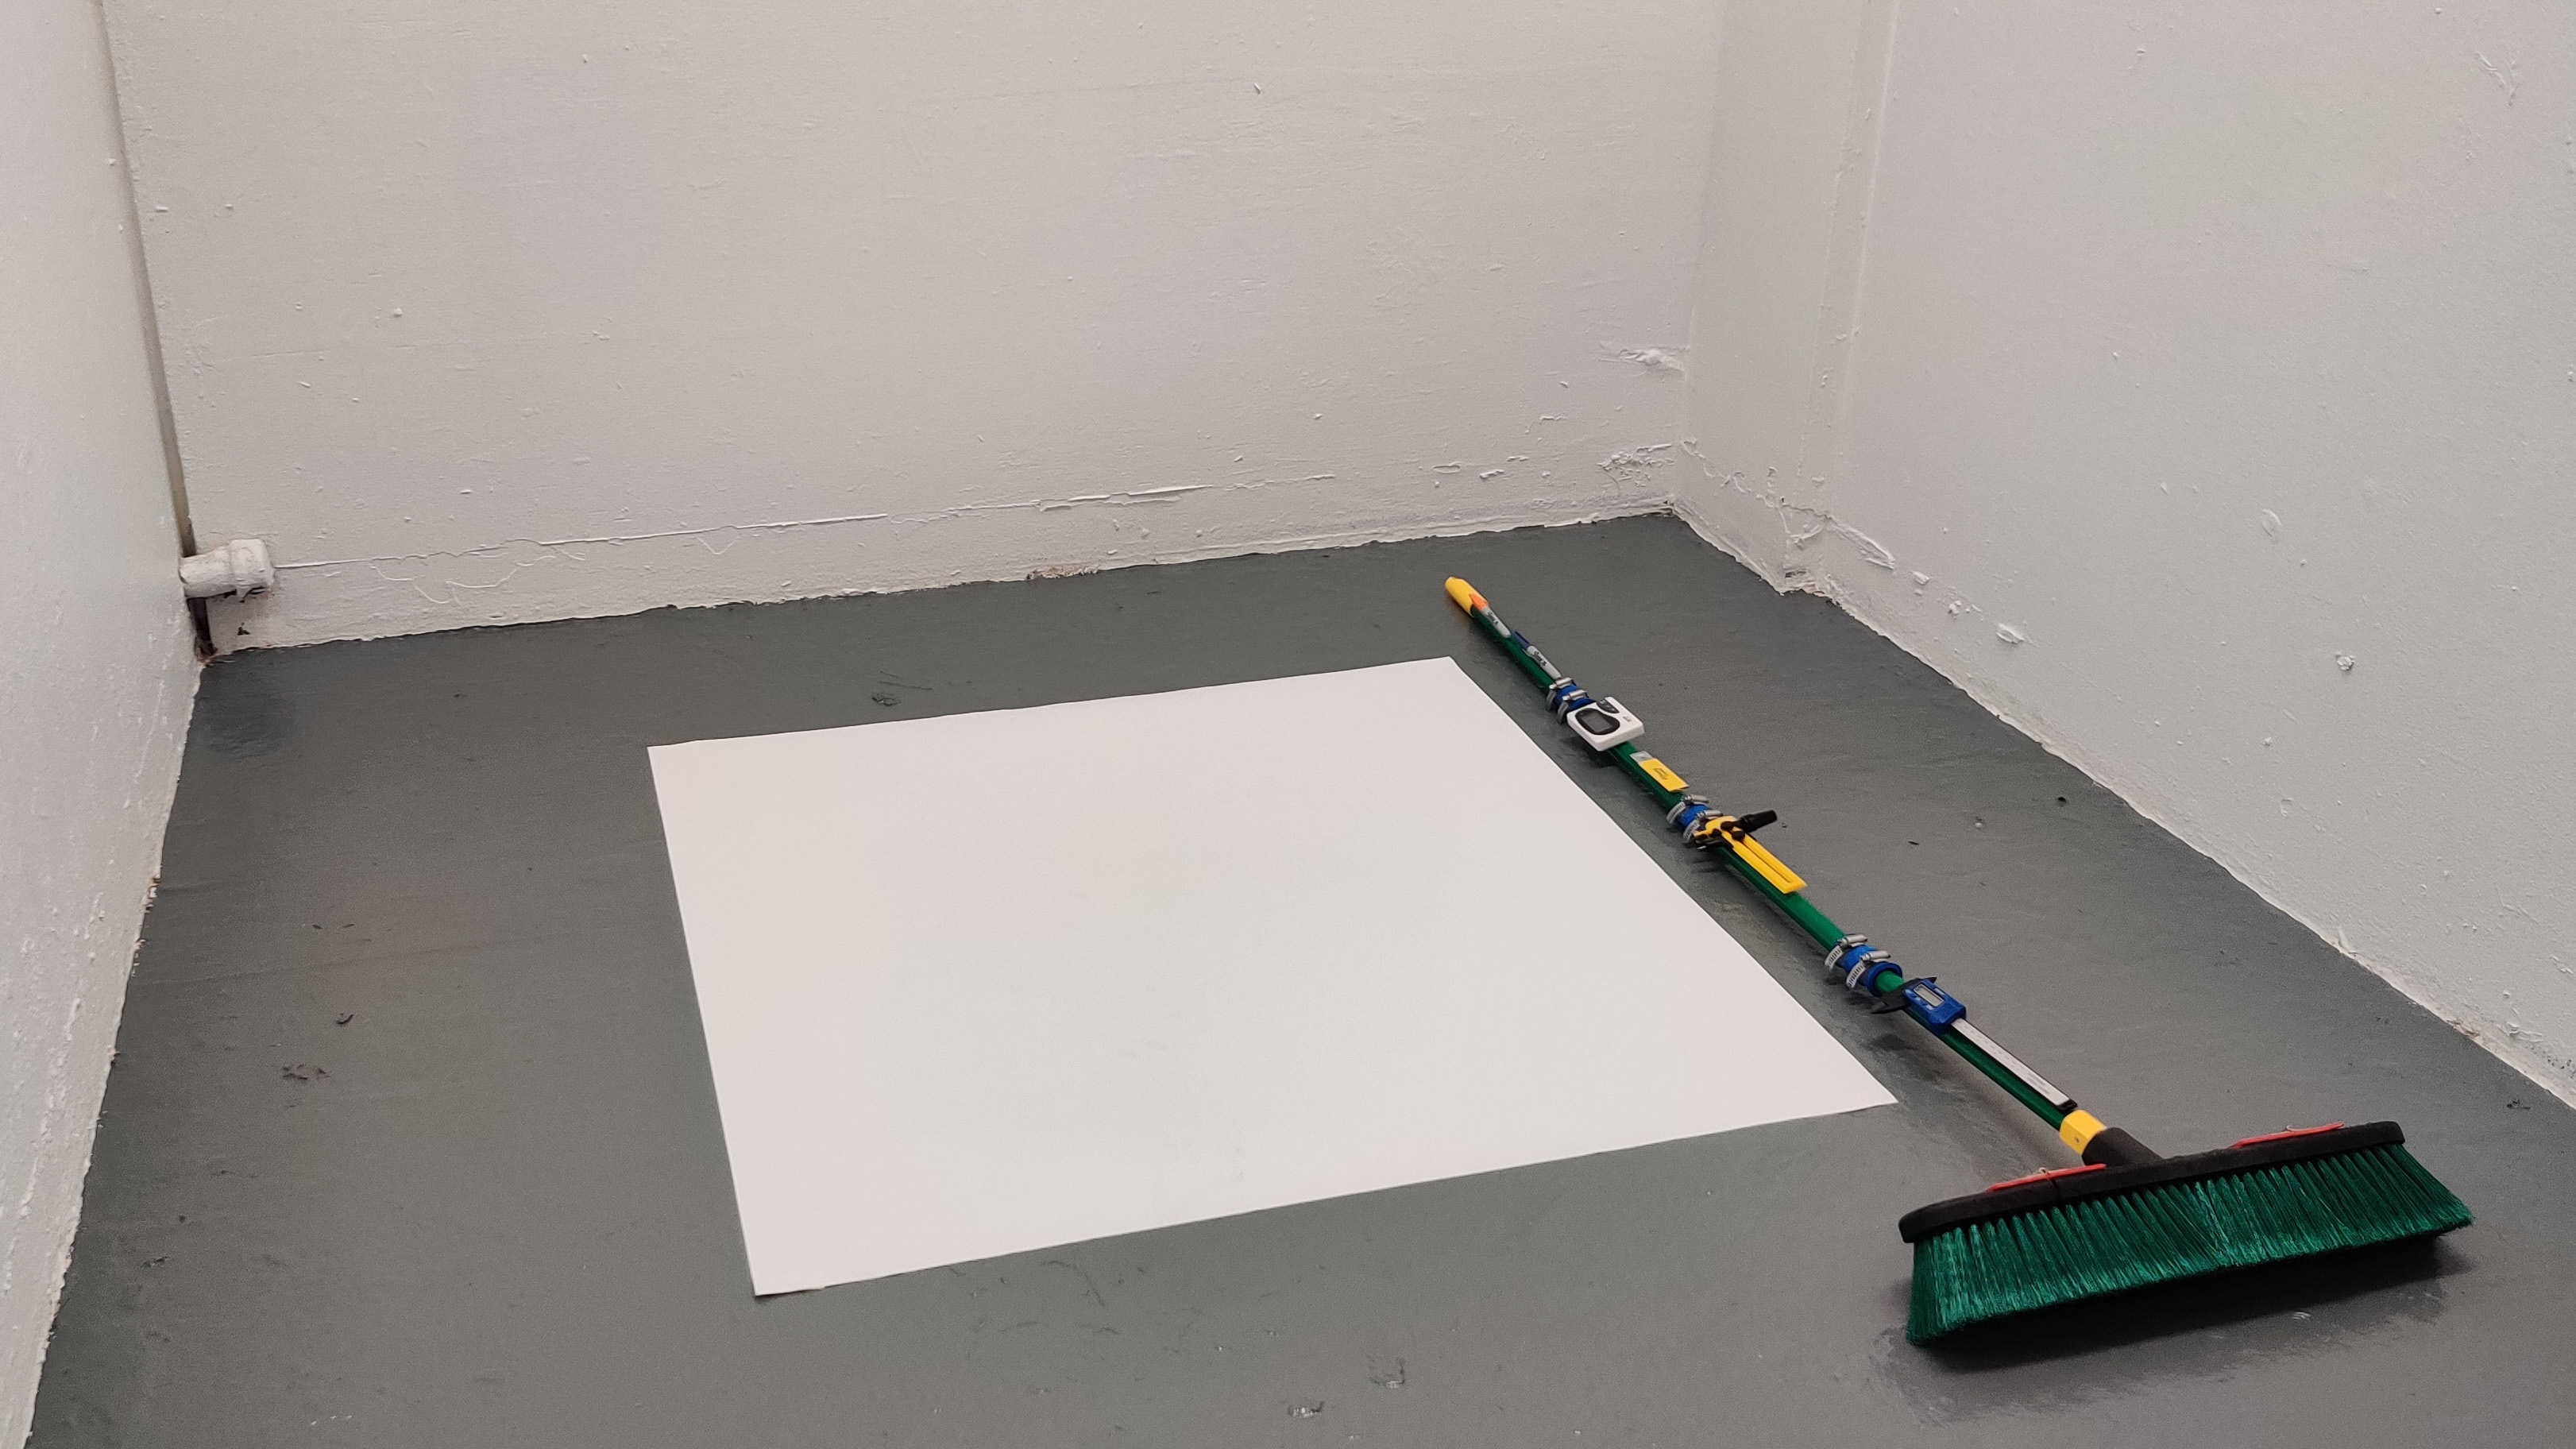
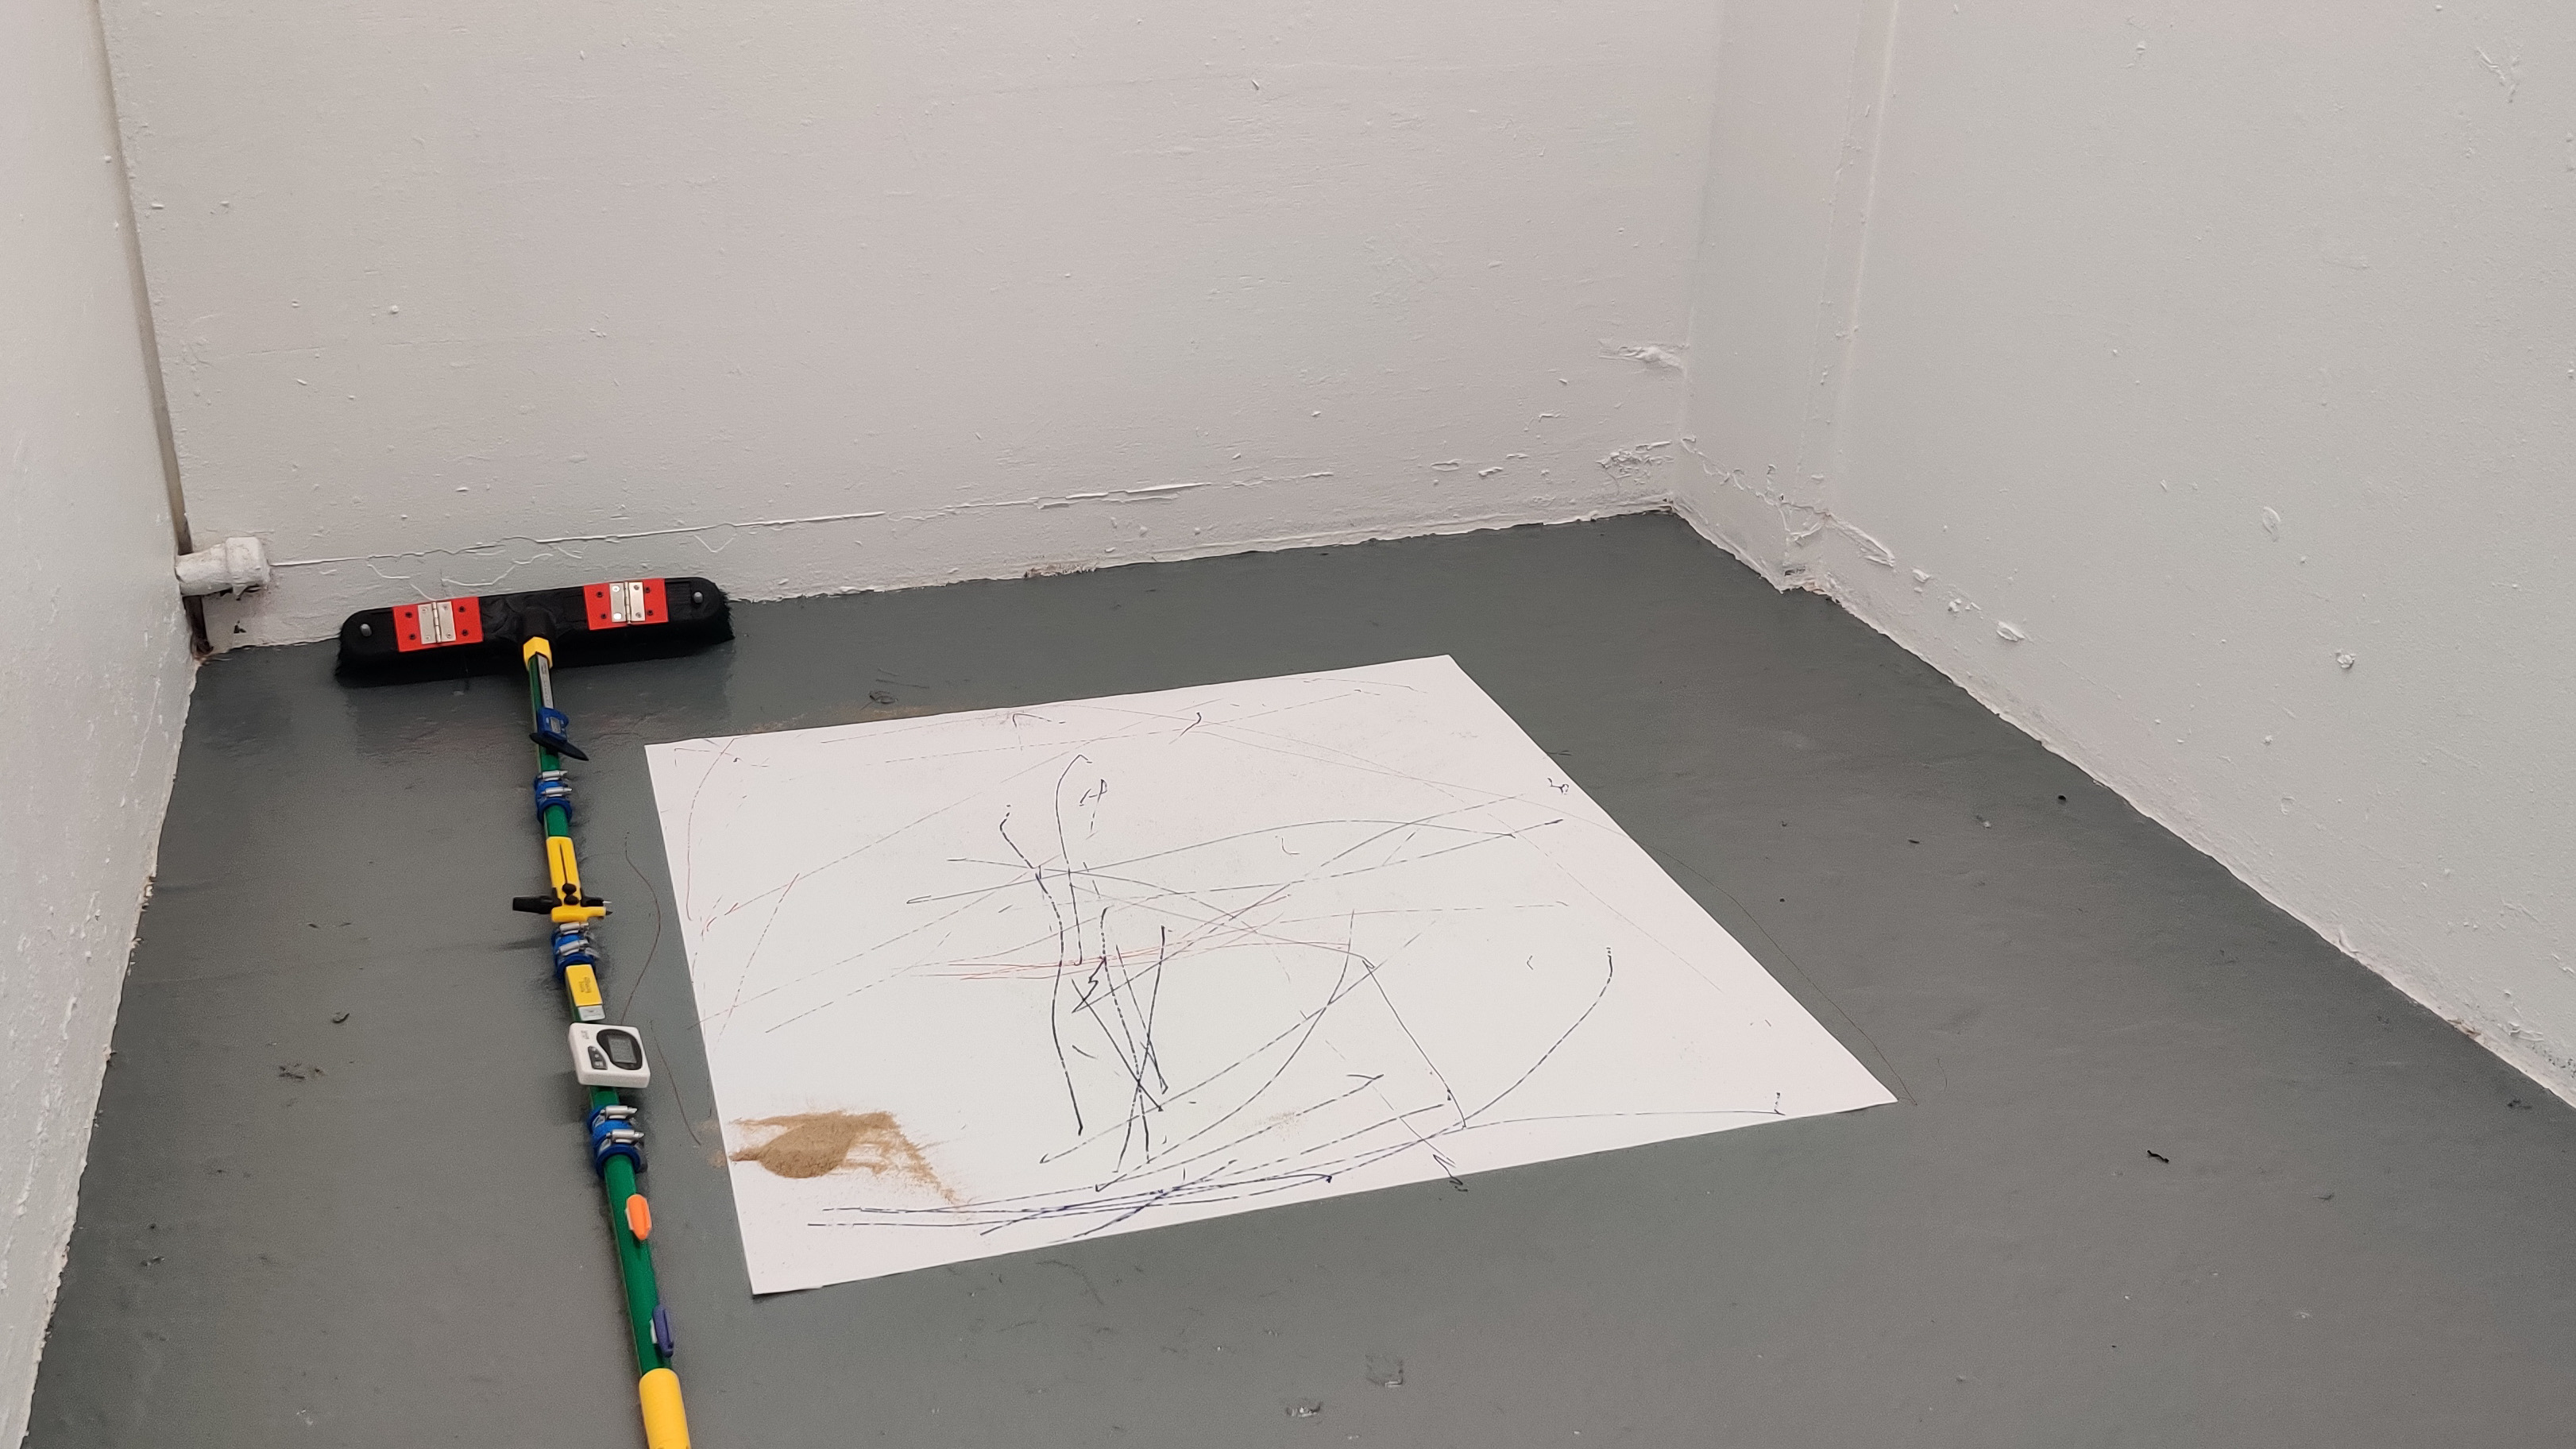
Sharpies making their mark
Circle of dust being released from the paper
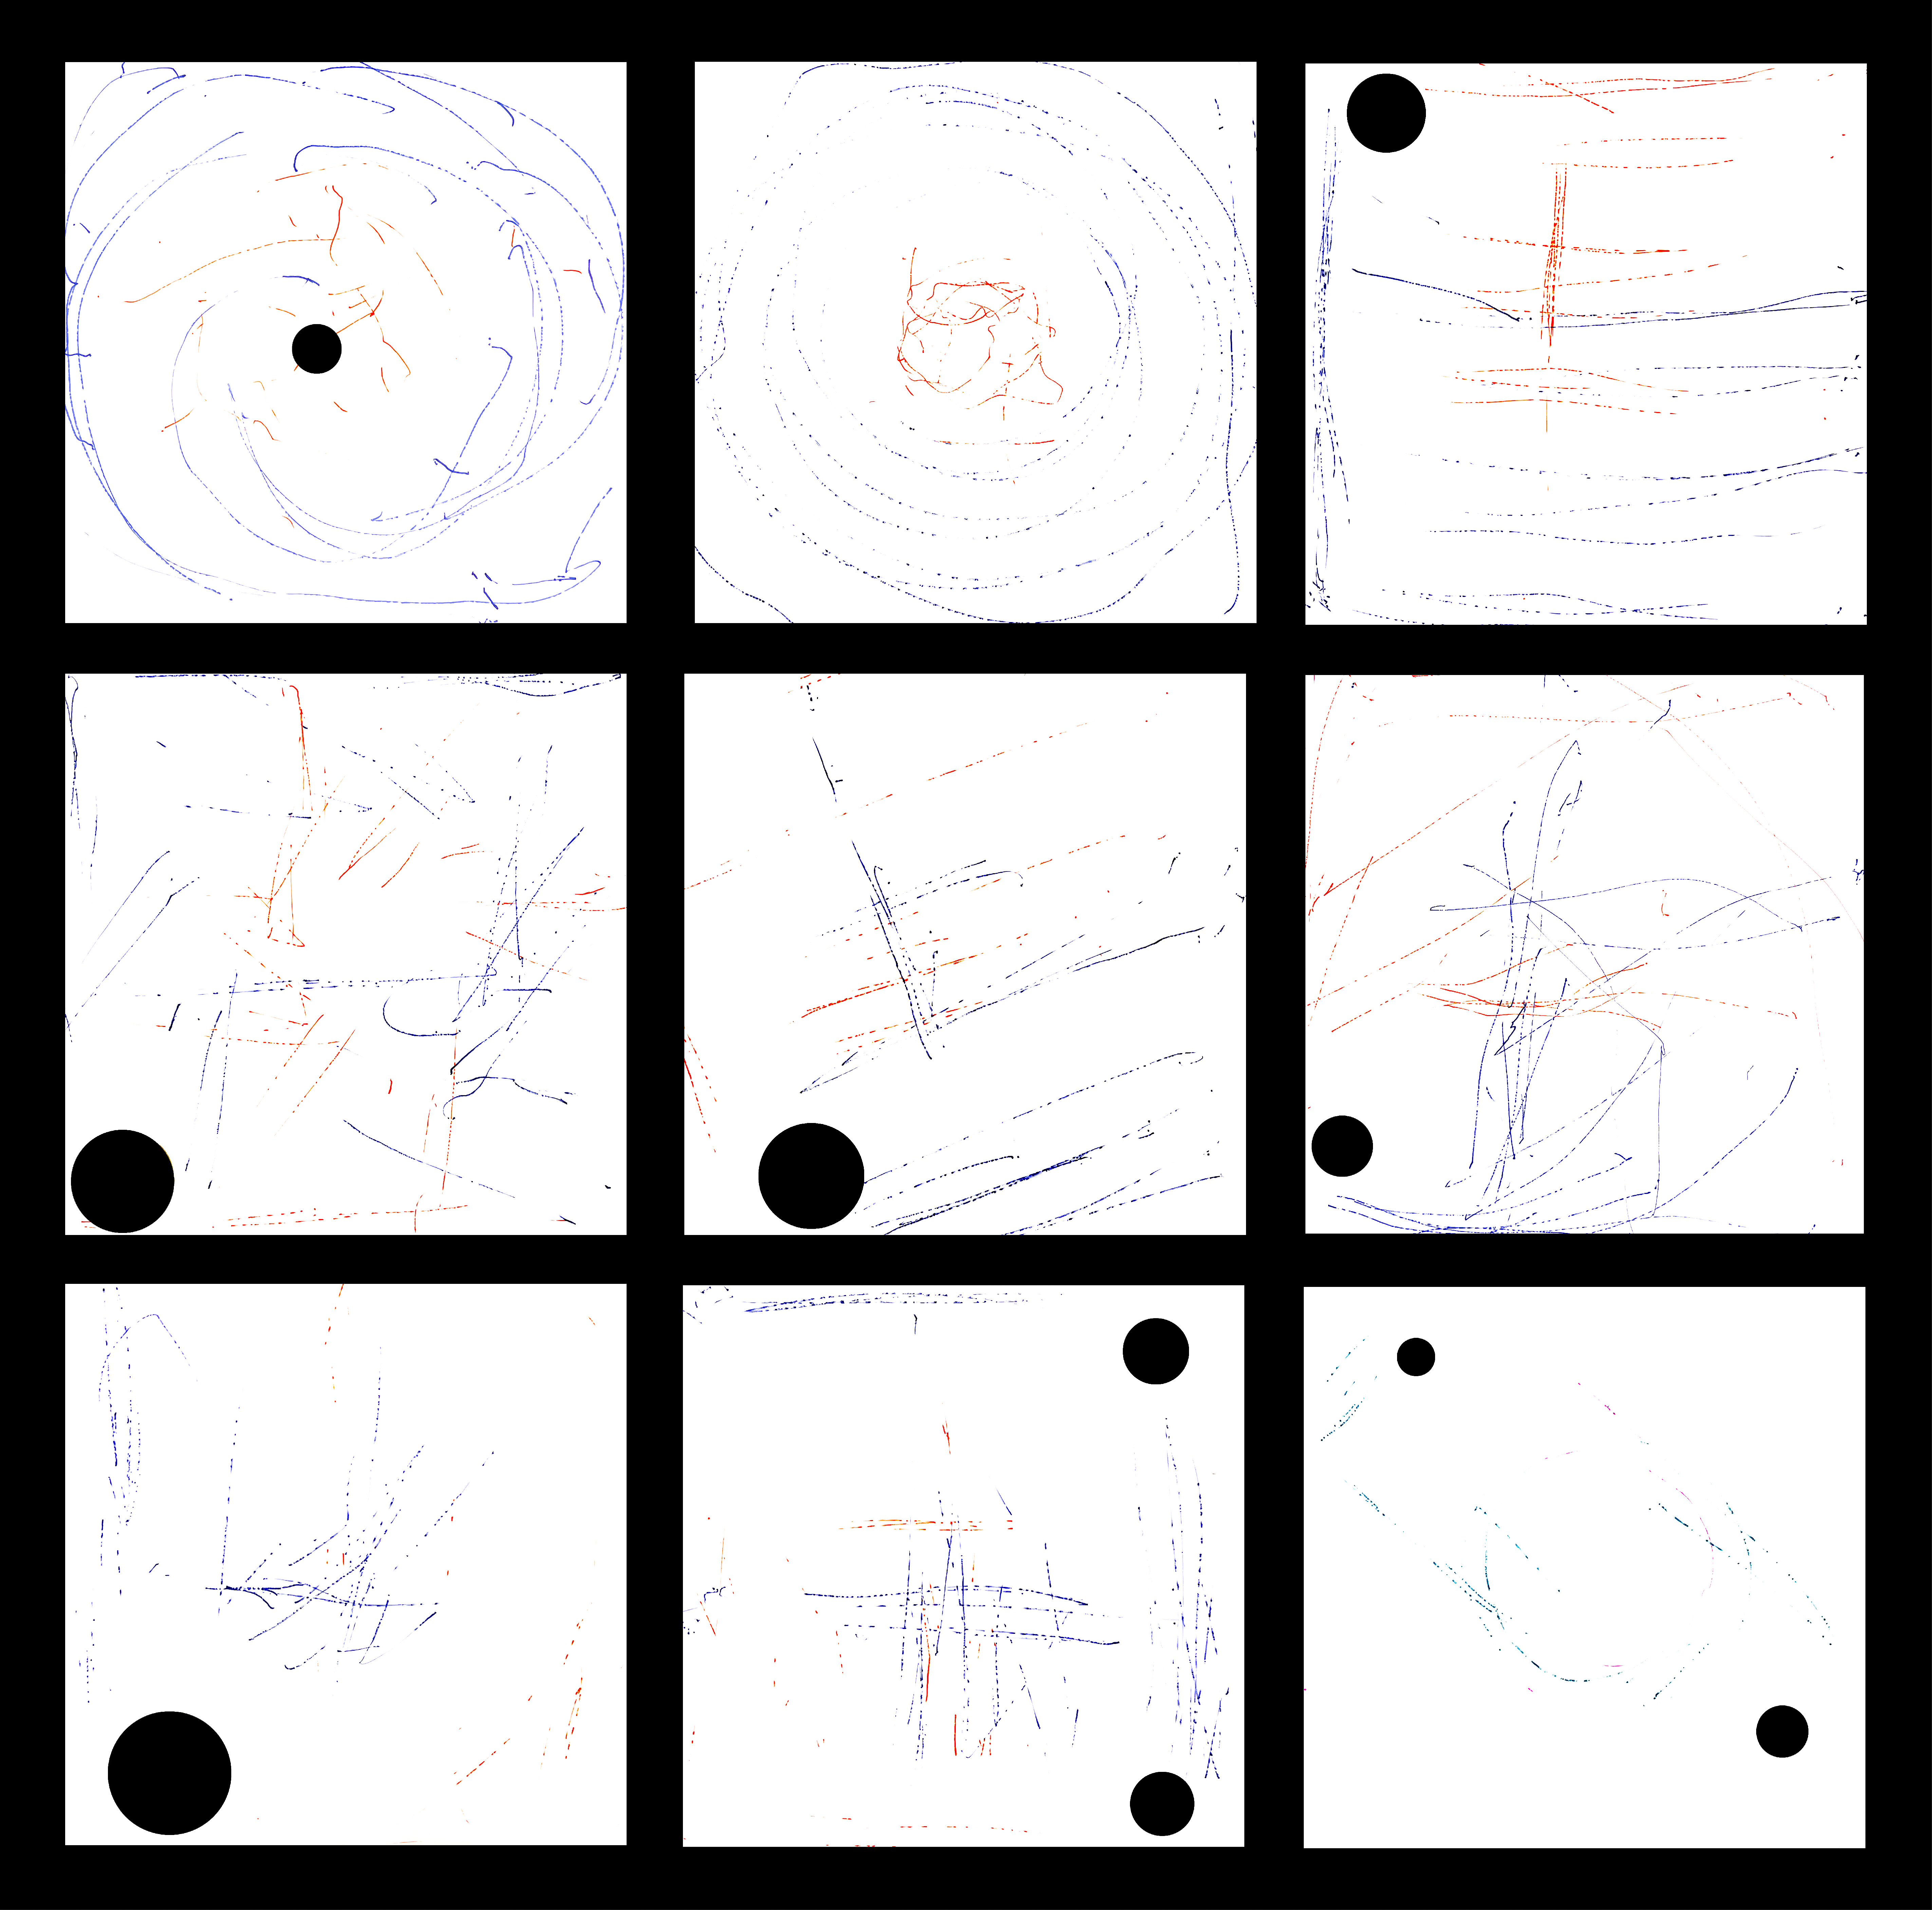
9 Samples Collected
The independent variable being the pattern of sweeping (tracked by orange and purple sharpies) and the dependent variable was the area of the circle of dust that would be collected at the end of each sweeping technique (cut out by a circle cutter, measured by a vernier caliper).

Before
After
PHASE 3: RESULTS
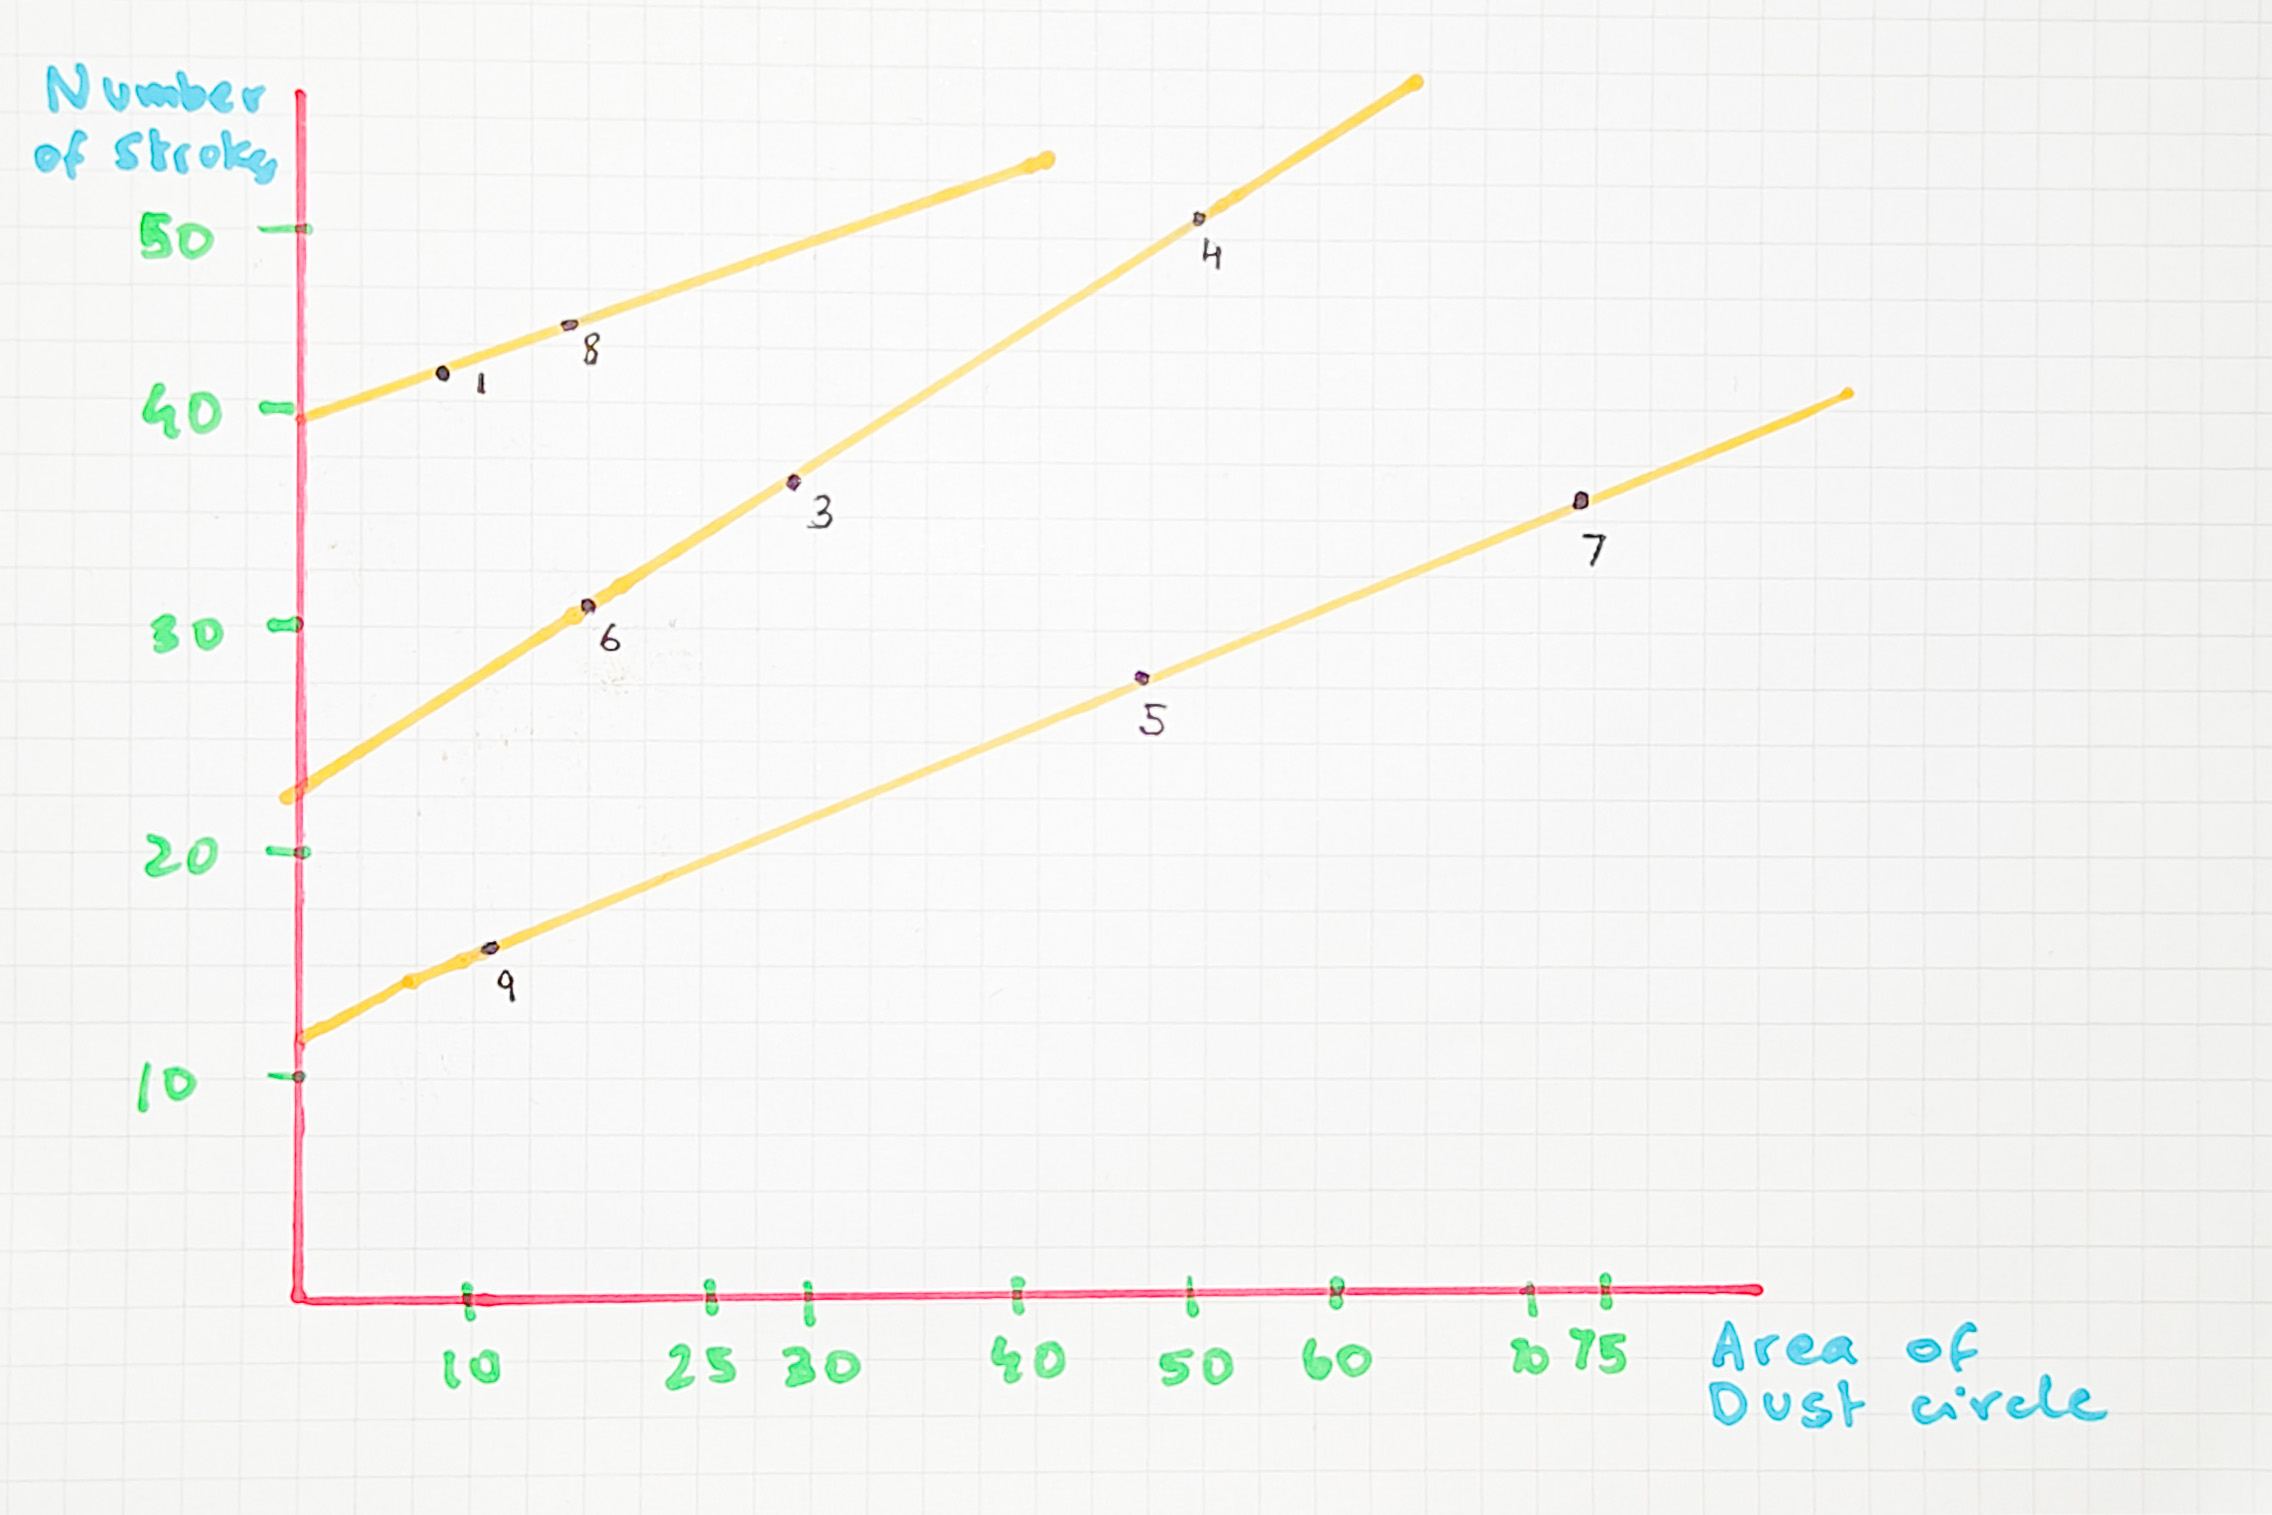
Results
The prediction was obvious, the more number of strokes the smaller the circle, as the dust is being pushed repetitively into one spot. However, this wasn’t the case. Let’s take data set number 2, where the dust was too spread out and no dust circle was formed even though there are multiple marks on the paper.
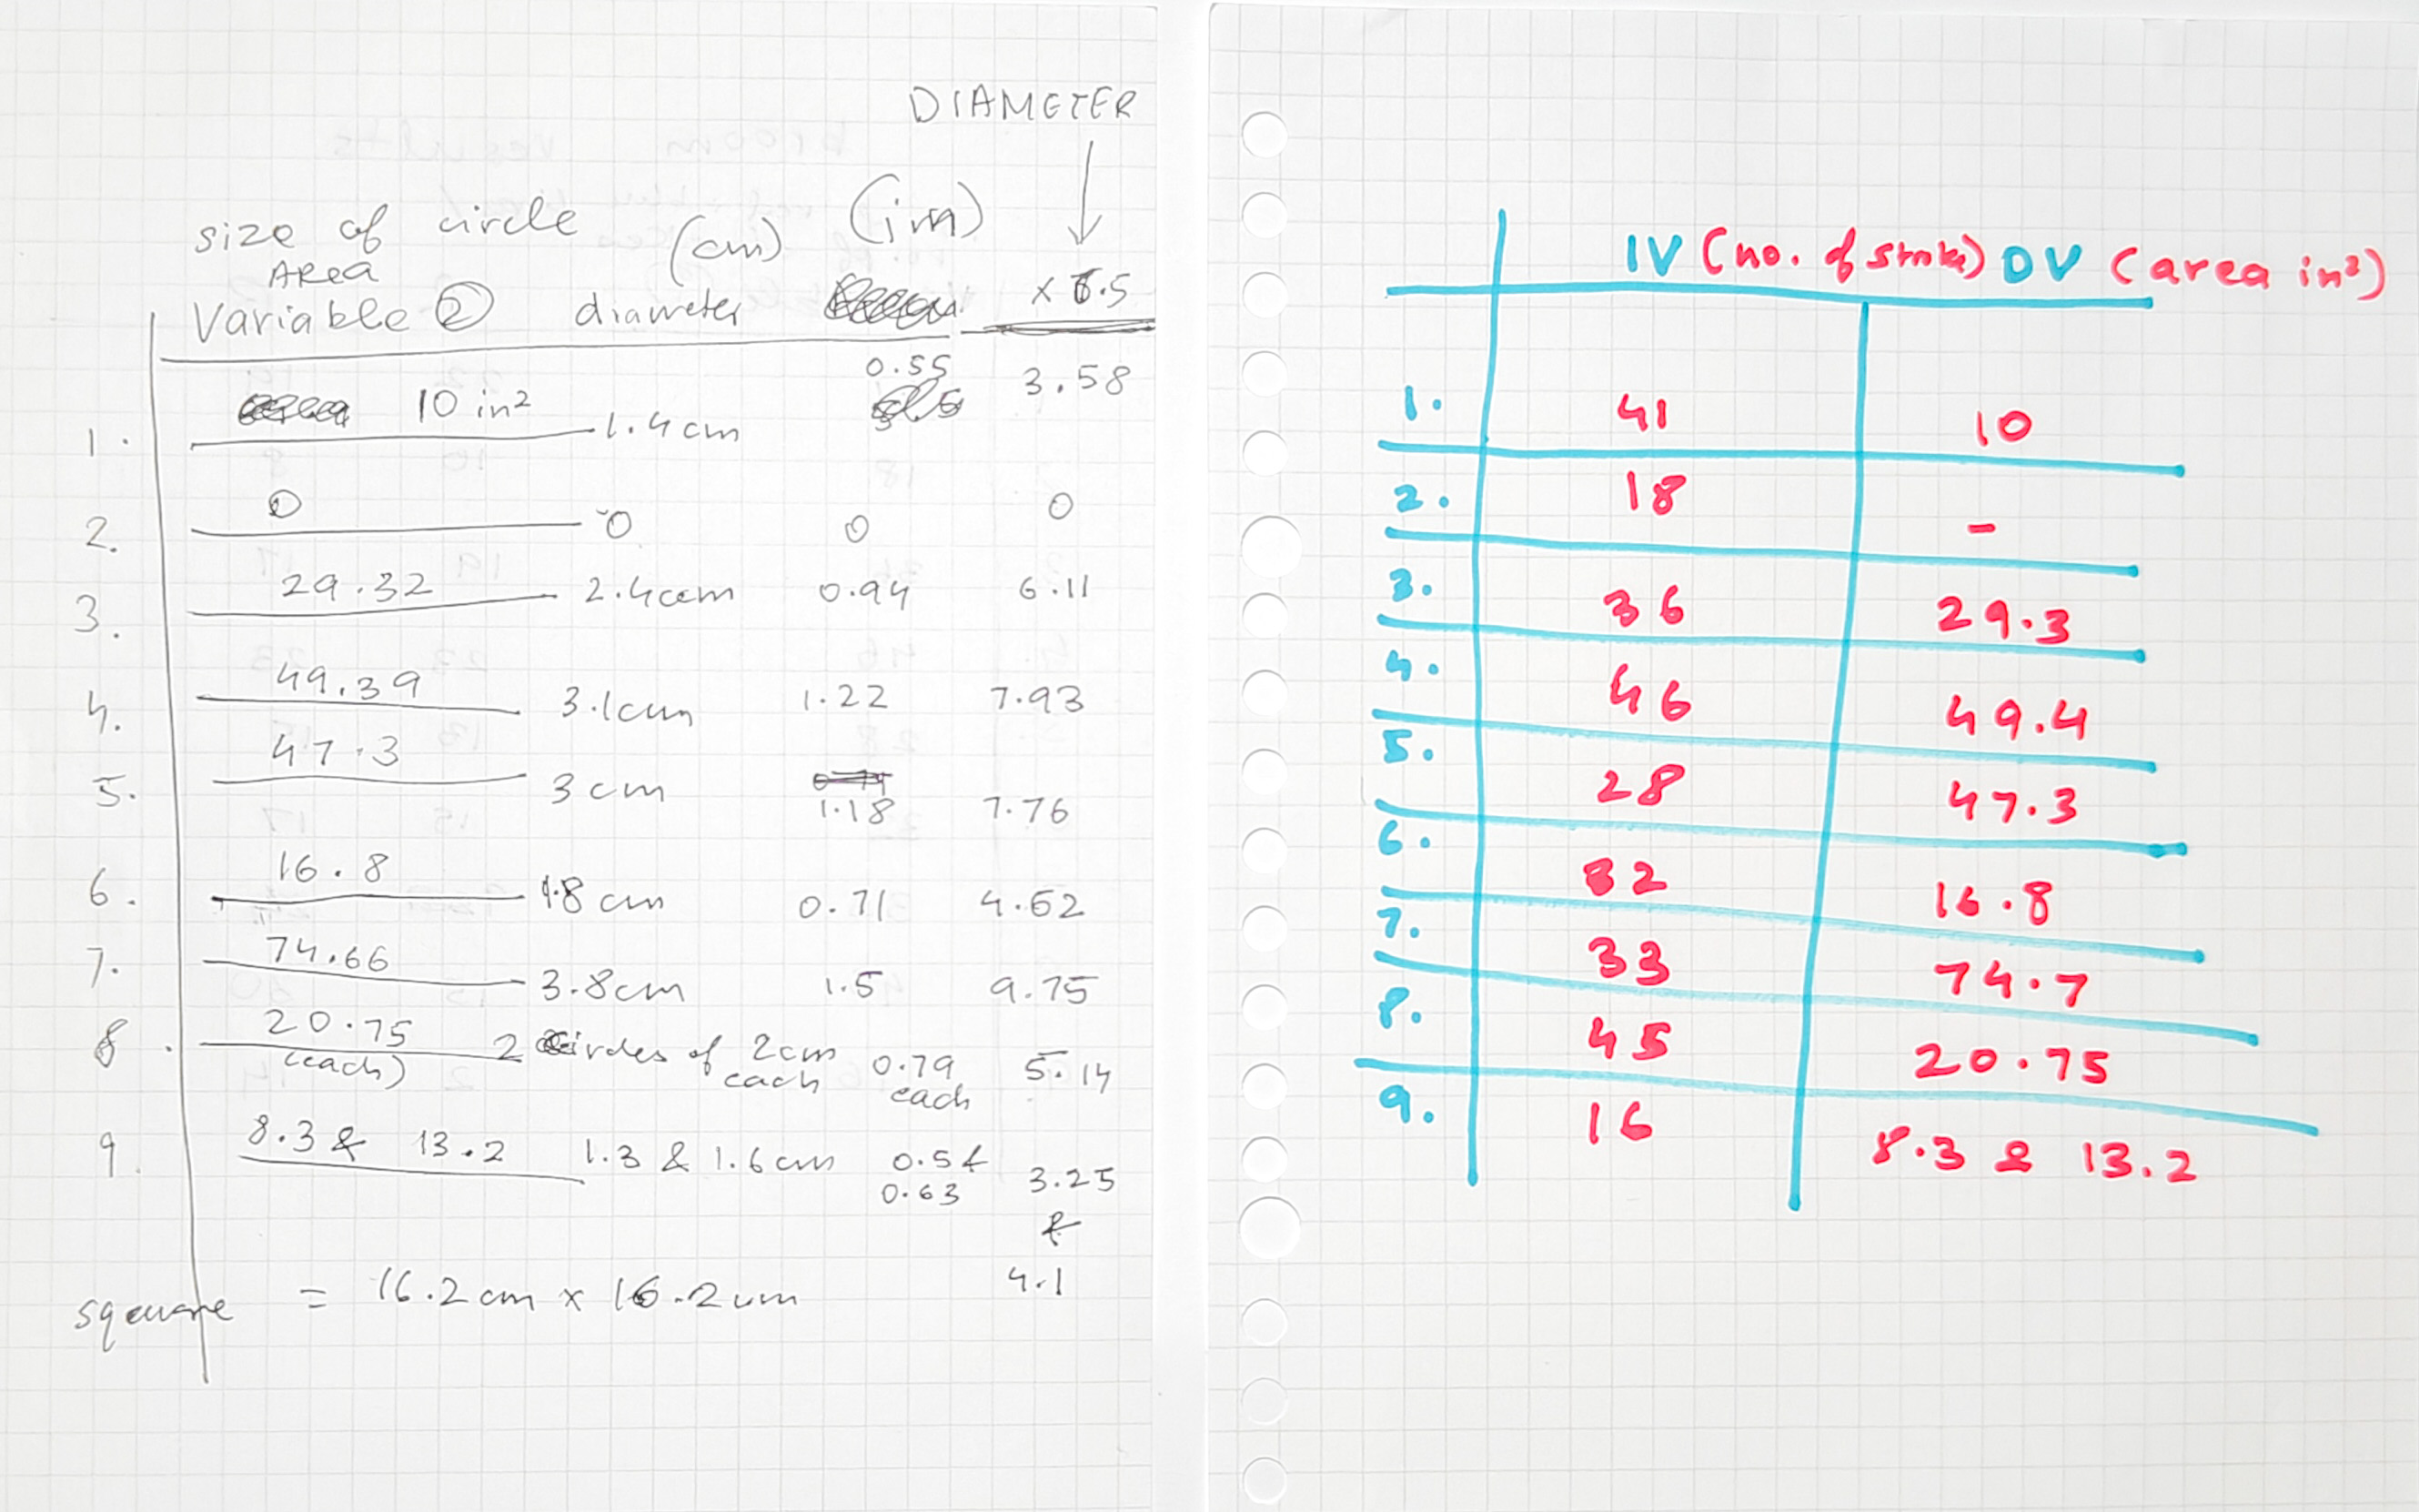
Analysis & Final Conclusions
An interesting correlation was forcibly formed. There are three different levels which form three perfect straight lines. This tells us that when the number of strokes is between 0 and 25 the dust circle is linearly increasing, however as you approach 30 strokes, the circle shrinks considerably (number 4 can be considered an anomaly). The top-most line tells us that are the number of strokes surpasses 40, the area of the dust circle does not exceed 20in2.
Research for Research’s Sake
Creating data for the ordinary tasks of every day is something design researchers do as an integral part of their job to understand their target consumers’ behaviors and needs. This project reorganizes that order, says “what if we were looking at it upside down all this time?”. The data is created without any goal in mind, and the uses for the data collected is meant to only come afterwards.

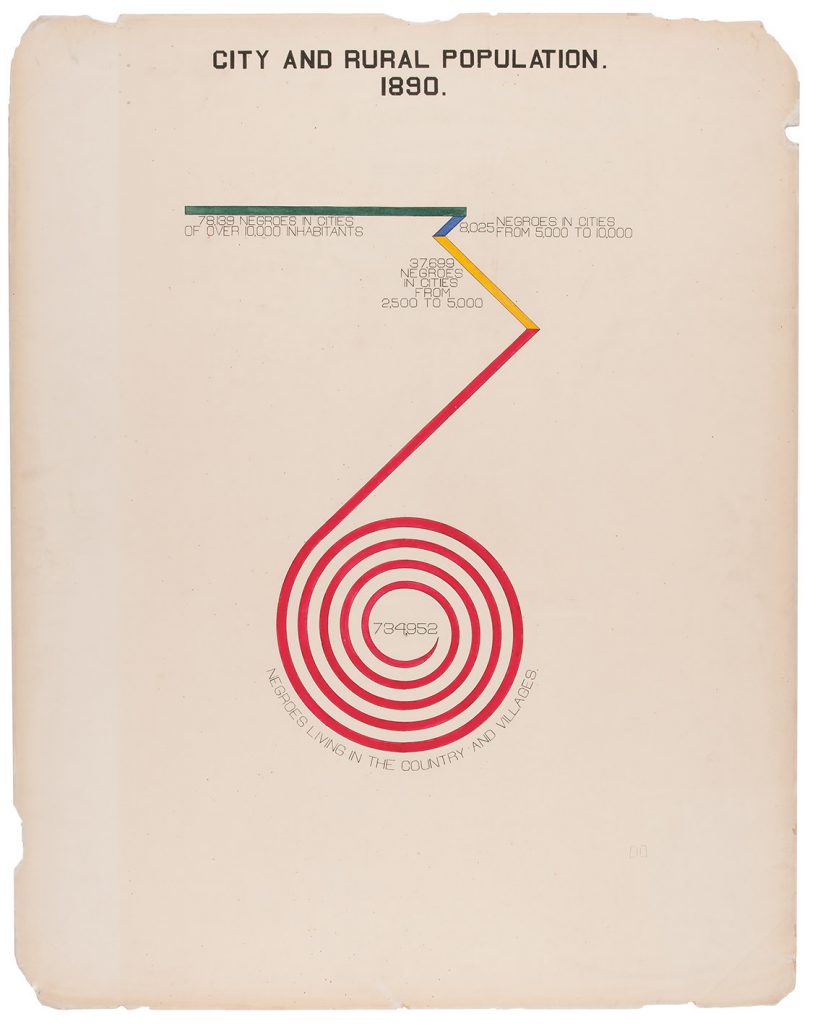

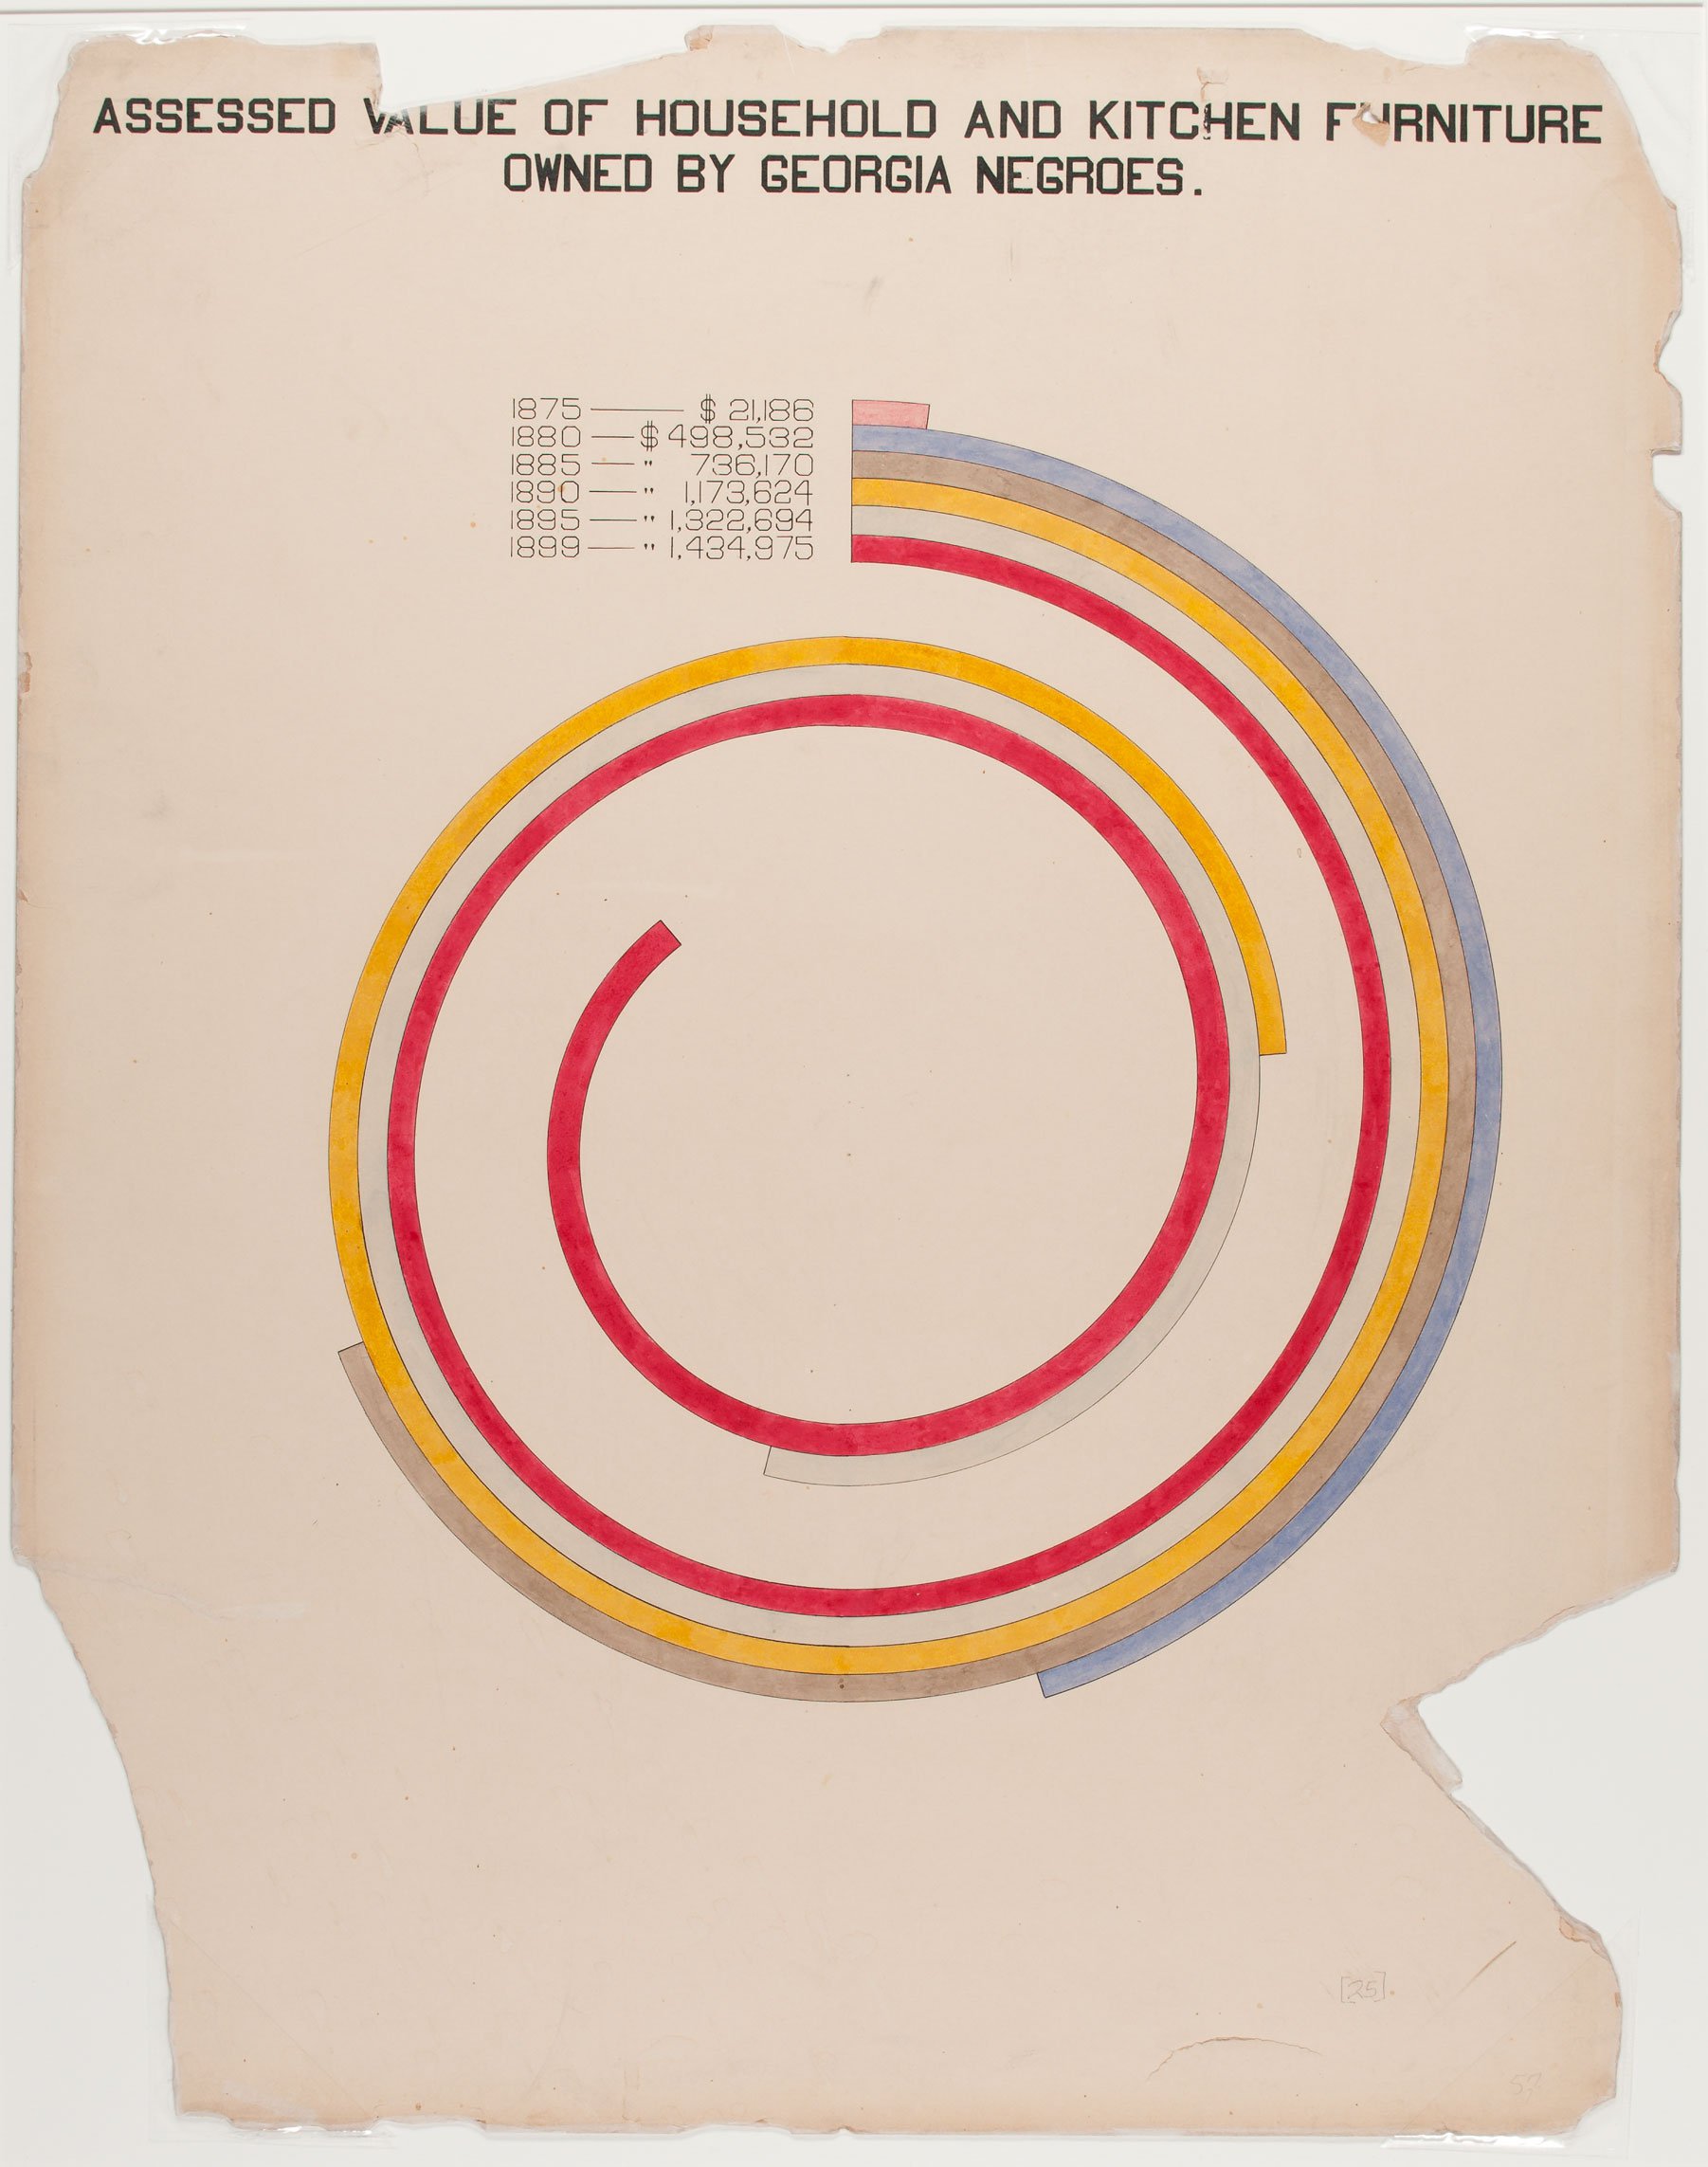
W. E. B. Du Bois's Data Portraits: Visualizing Black America

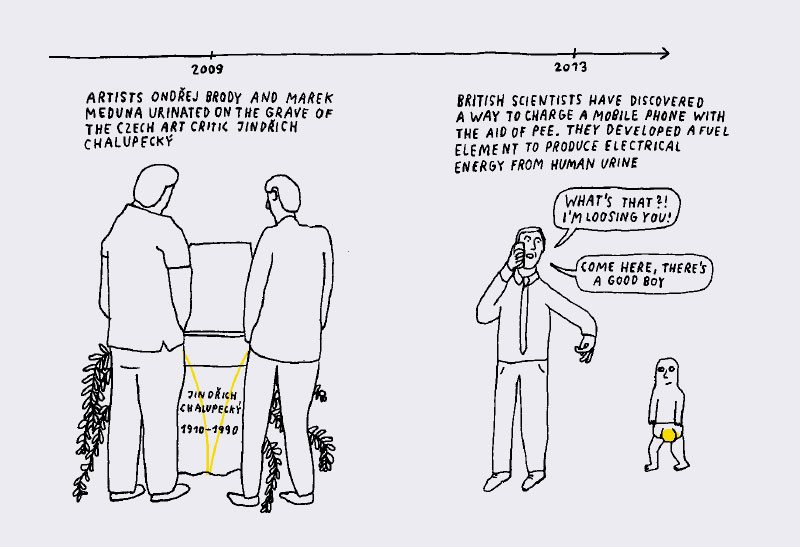
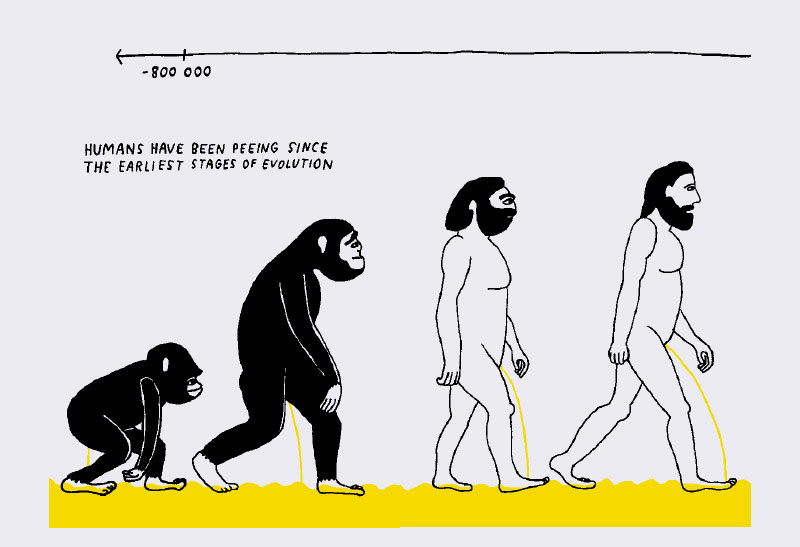
Jakub Plachý’s The Big Book of Peeing
Further Explorations
Two very different sources came to mind when doing this project. The collection by Du Bois uses a mix of eccentric or specific facts like ‘value of household and kitchen furniture’ owned by African-Americans in Georgia in the 80’s to speak about the state of racial progress in the country. The other piece of fantastic visualization of research is Plachý’s book on peeing. The research points out many problems around public hygiene, the key being the lack of public toilets in the Czech Republic. Both are very important representatives of how data and the organization of it can bring humor and radical change to the world.

REFERENCES
Research conducted under the guidance of award-winning designer and architect,
Allan Wexler. Author of Absurd Thinking: Between Art and Design.
Works Cited:
Bök, Christian. Pataphysics: The Poetics of an Imaginary Science. Evanston, IL: Northwestern University Press, 2002.
Bois , W. E. B. Du. “Data Visualization, ‘City and Rural Population. 1890, 1900;” Atlanta, Georgia, USA: Library of Congress Prints and Photographs Division, 1900. Cooper Hewitt. New York.
Plachý, Jakub, Anna Lordan, and Andrew Lass. The big Book of Peeing. Labyrint, 2015.
Sachs, Tom. "Spaceships." October 7, 2023. Acquavella Gallery, New York.